|
|
|

 A physician uses a portable electronic tablet to enter patient data while in the examination room.
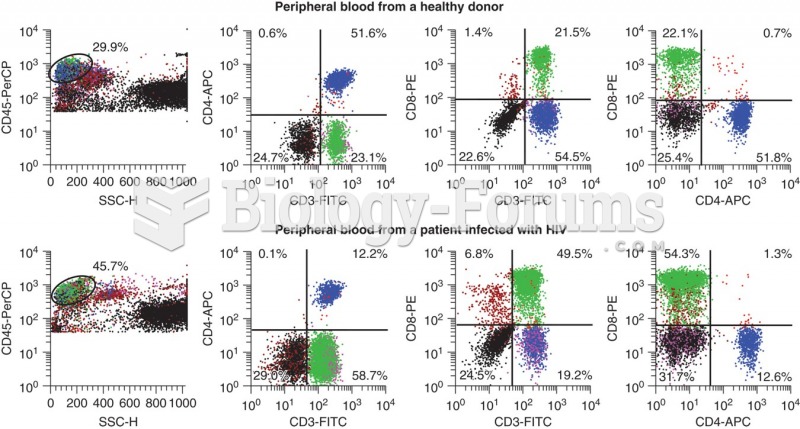 Flow data for a healthy donor (top panel) and a HIV positive patient. CD3 is a T-cell marker, CD4 is ...
 How to find the quartiles and percentiles for a data set
 How to calculate the mean for grouped data
 Data for Calculating Productivity Growth in Erewhon
 A hypothetical grid of data used in synteny testing