|
|
|

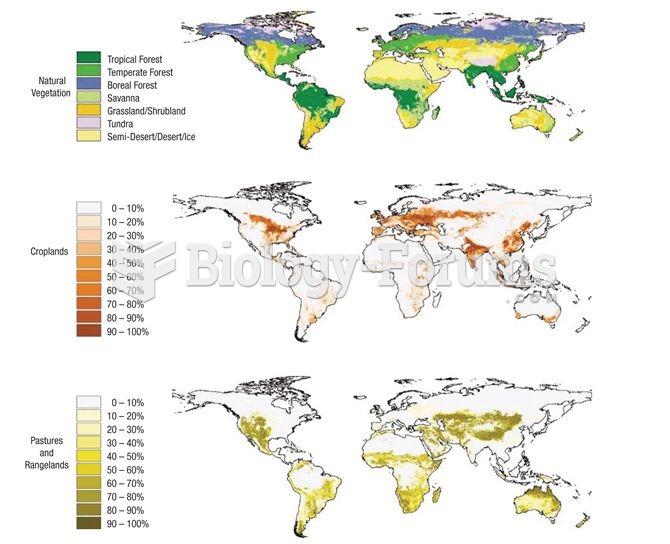 Extent of agricultural activity across the planet (data from Foley et al. 2005).
 Critical thinking involves analysis in which the nurse examines patient data available from a variet
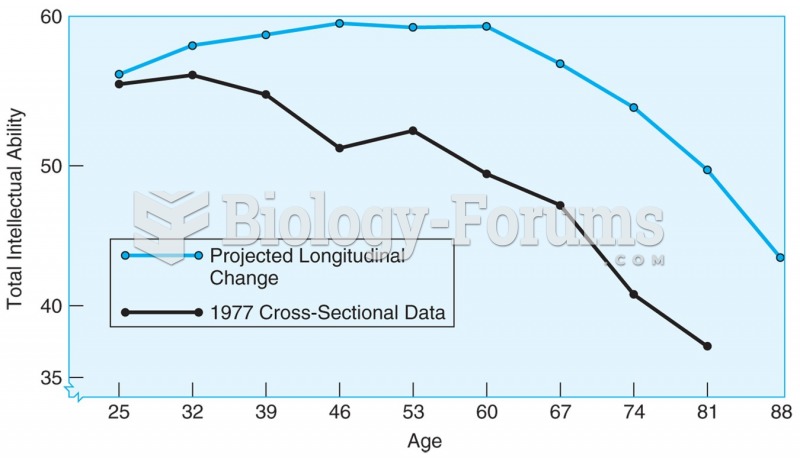 4.1 Age changes in total IQ based on cross-sectional data (lower line) and longitudinal data ...
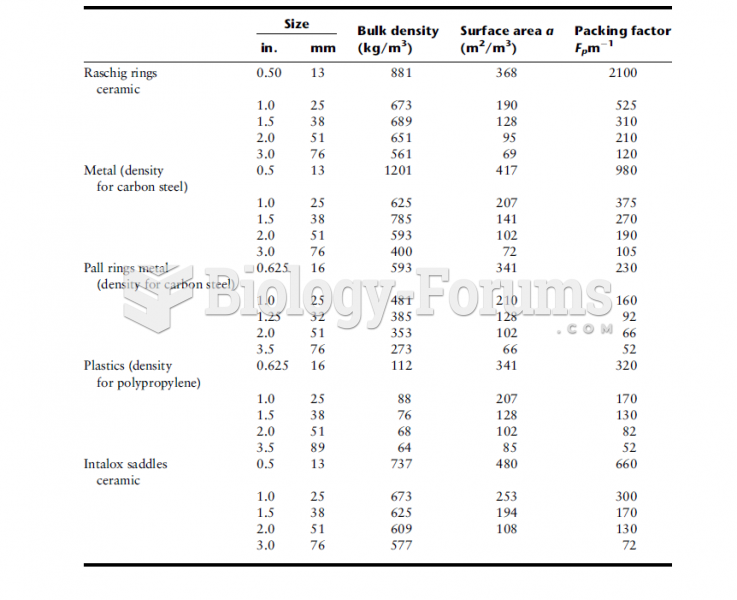 Design Data for Various Packings
 Acquiring Weather Data
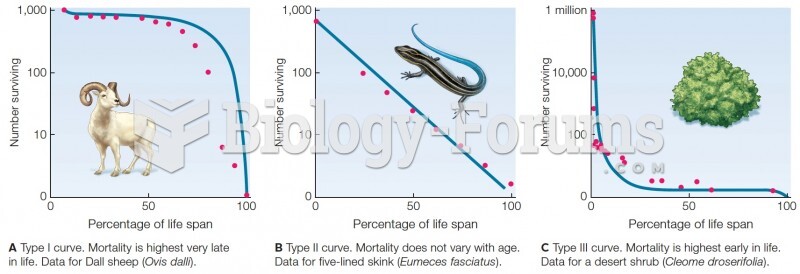 Survivorship curves. Blue lines are theoretical curves. Red dots are data from field studies.