This topic contains a solution. Click here to go to the answer
|
|
|

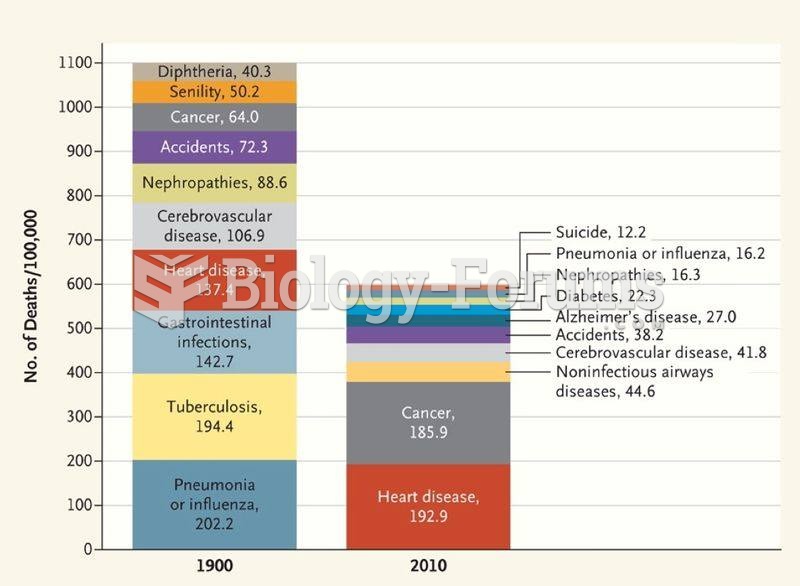 Morbidity chart
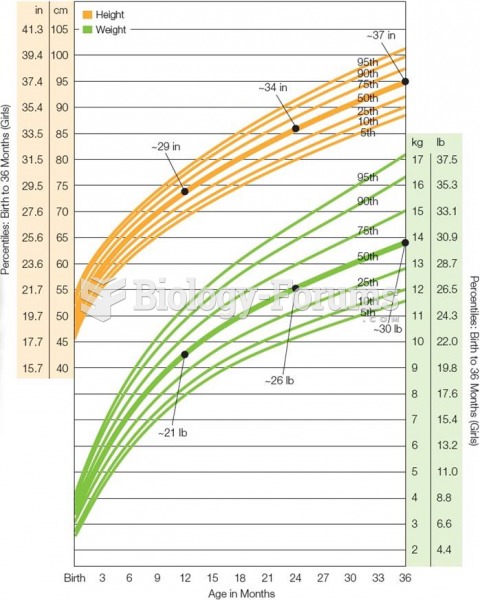 Growth Chart for American Girls From Birth Through Age 3 Growth slows from infancy to toddlerhood b
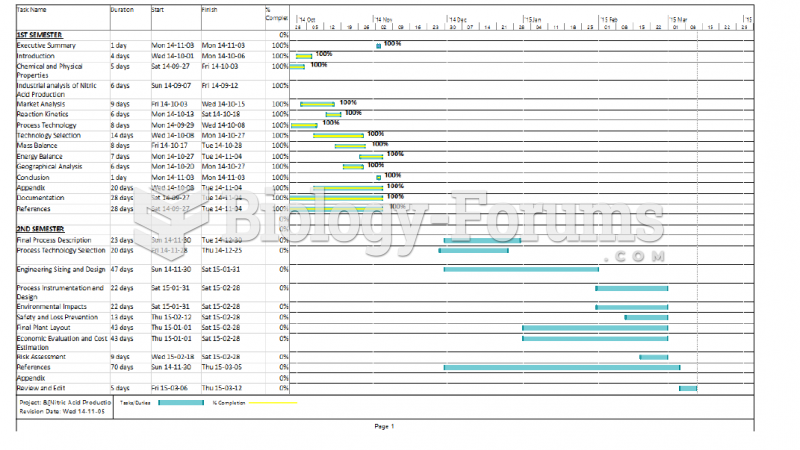 Gantt Chart
 Sections of a Research Report
 Japanese cultural Display Rules
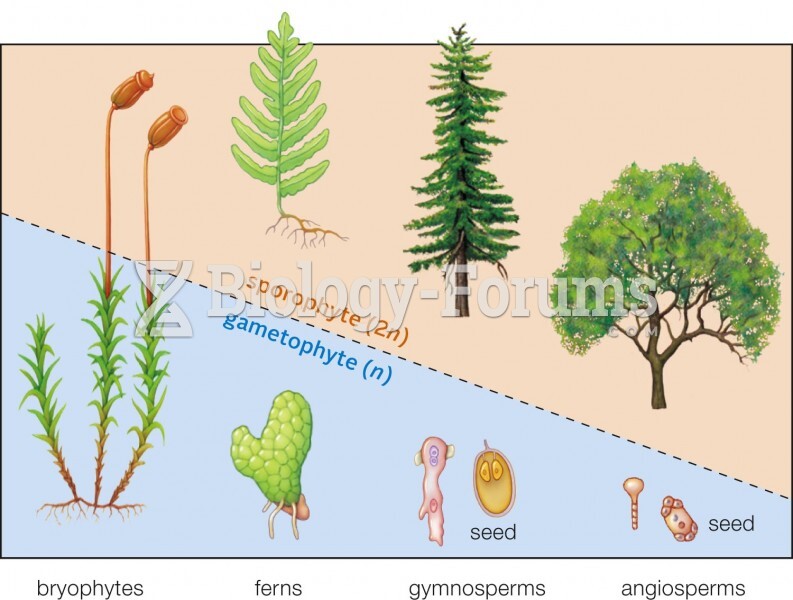 Evolutionary trend in plant life cycles