Graphically, economic growth is represented as
A) a movement along the production possibilities curve.
B) a movement from a point inside the production possibilities curve to a point on the curve itself.
C) an inward shift of the production possibilities curve.
D) an outward shift of the production possibilities curve.
Question 2
A model is used to explain economic behavior. Therefore
A) the assumptions must be complex while the model itself is simple.
B) the model must be complex.
C) the model must be simple.
D) the model can be either simple or complex so long as it explains economic behavior.

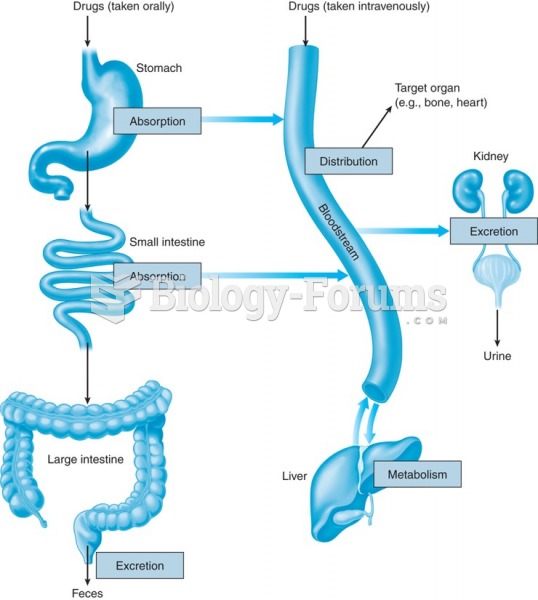 Movement of a drug through the body (pharmacokinetics): absorption, distribution, metabolism, and ...
 Economic Globalization
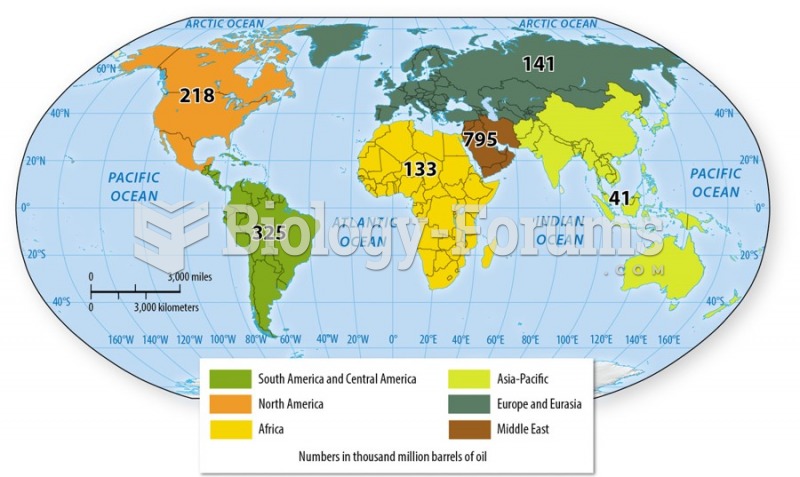 Growth in the demand for oil from the developing world
 U.S. Output and Productivity Growth, 1870–2007
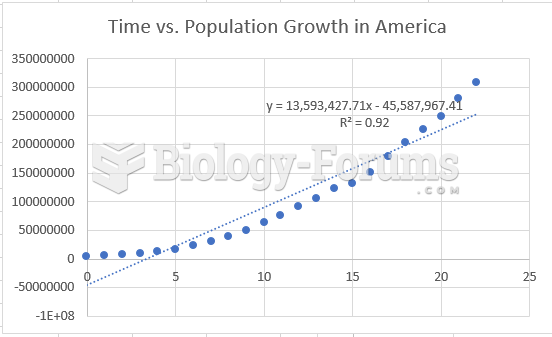 Population Growth in America
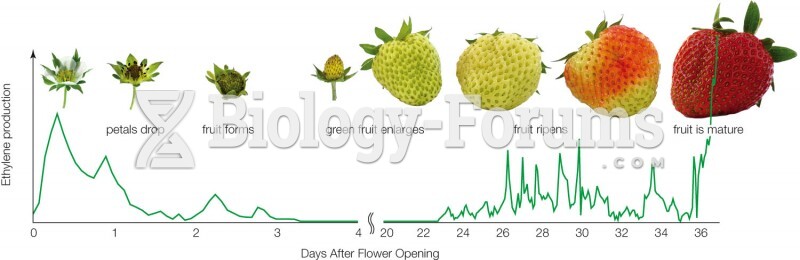 Ethylene Production During Strawberry Ripening