This topic contains a solution. Click here to go to the answer
|
|
|

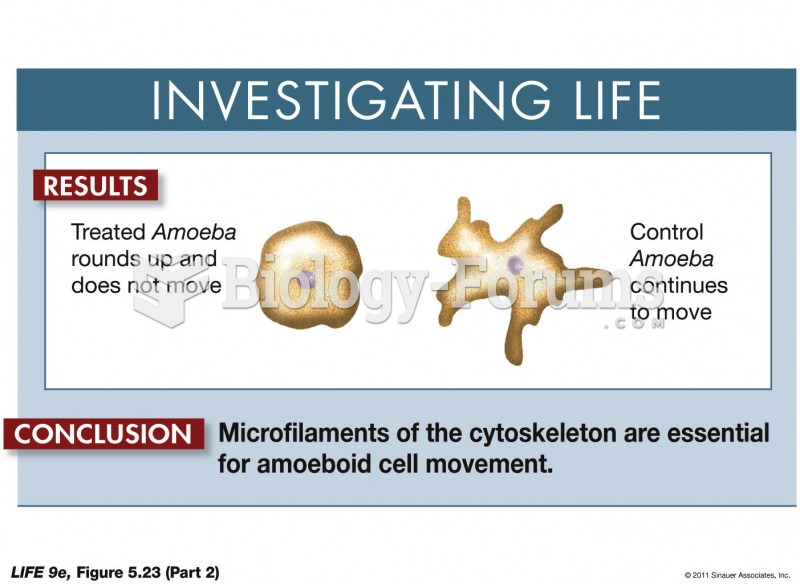 The Role of Microfilaments in Cell Movement-Showing Cause and Effect in Biology 2
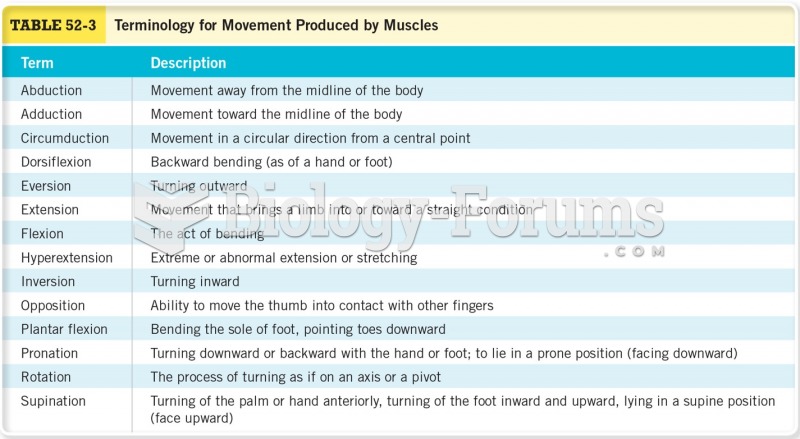 Terminology for Movement Produced by Muscles
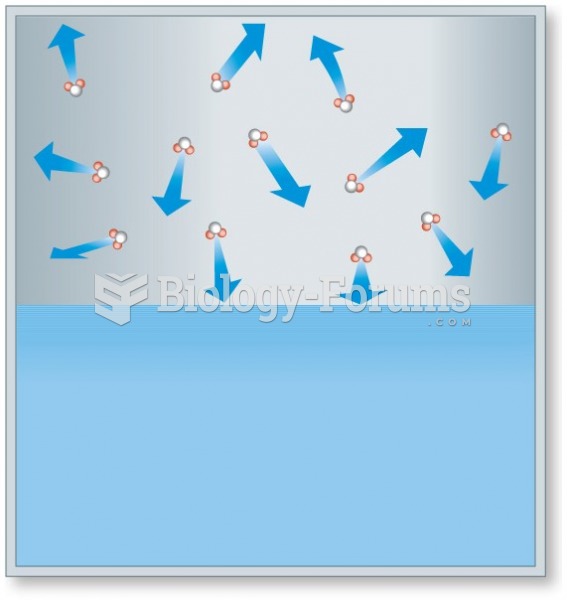 The movement of water vapor molecules exerts vapor pressure on surfaces.
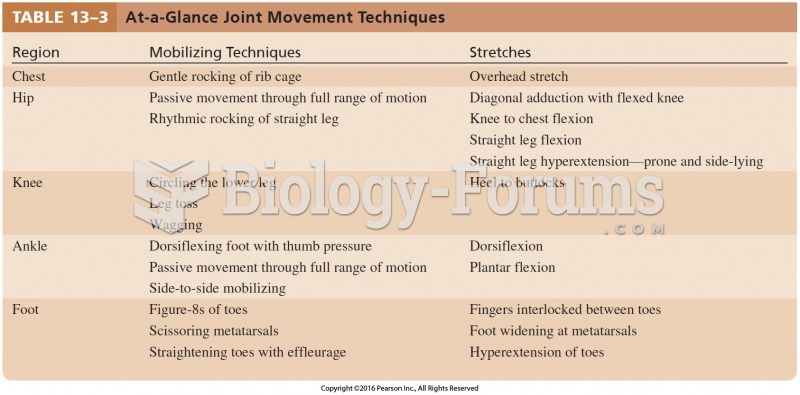 At-a-Glance Joint Movement Techniques Cont
 Mobilize each metatarsal–phalangeal joint with figure-8s. Hold the tarsal just below the ...
 Figure 2.15.jpg