|
|
|

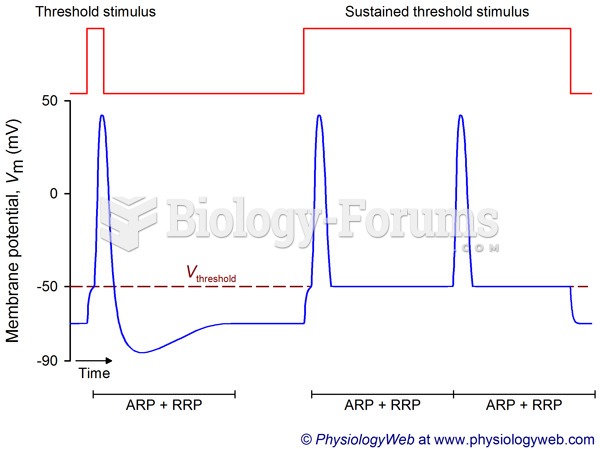 Frequency coding in the nervous system: Threshold stimulus.
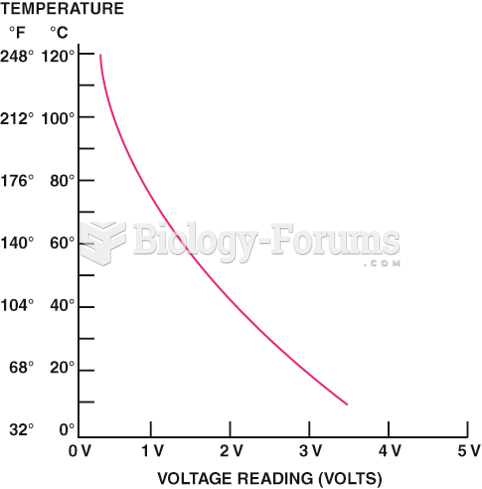 A typical ECT sensor temperature versus voltage curve.
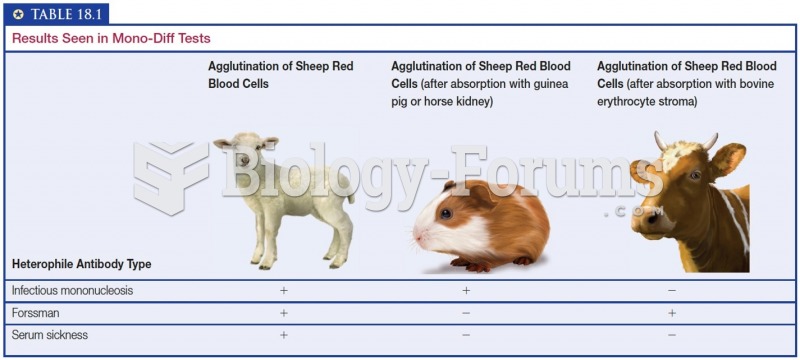 Results Seen in Mono-Diff Tests
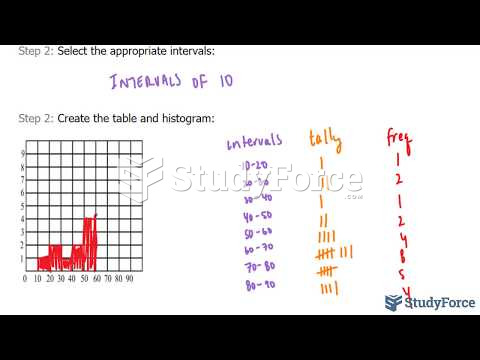 How to create a frequency table and histogram from raw data
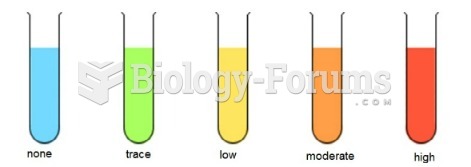 Benedict's test results
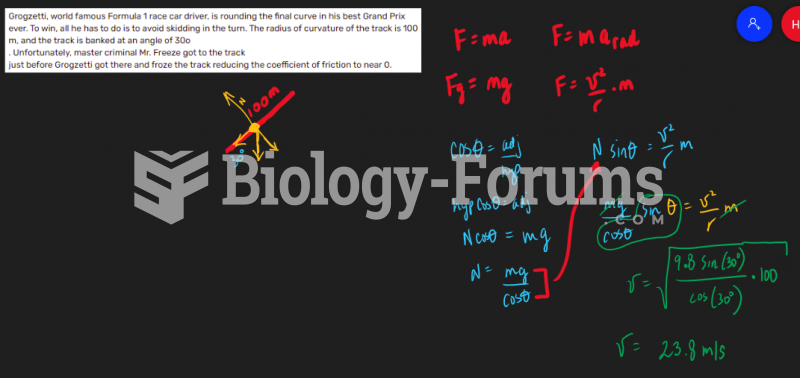 At what speed does Grogzetti need to take the curve to avoid sliding?