The supply curve for watches
A) is downward sloping.
B) shows the relationship between the quantity of watches firms are willing and able to supply and the quantity of watches consumers are willing and able to purchase.
C) shows the supply of watches consumers are willing and able to buy at any given price.
D) shows the relationship between the price of watches and the quantity of watches supplied.
Question 2
Refer to Figure 7-1. Marginal social benefit is represented by which curve?
A) Supply
B) D1
C) D2
D) All of the above represent marginal social benefit.

 Proteomes and their relationship to cell structure, function, and organization.
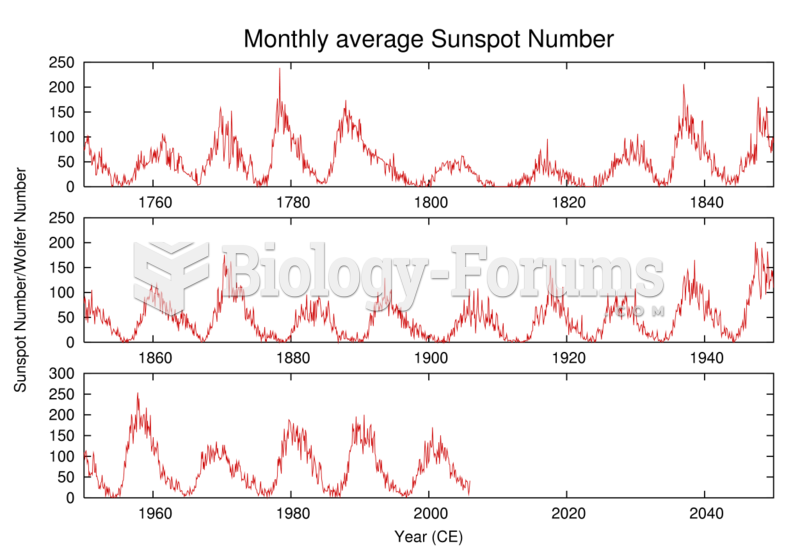 History of the number of observed sunspots during the last 250 years, which shows the ~11-year solar
 A sigmoid (cooperative) binding curve
 The overlapping relationship among research, evidence-based practice
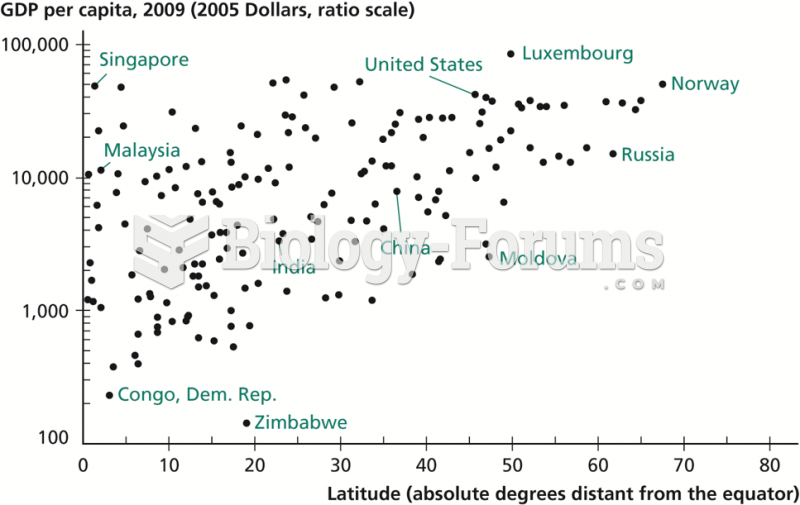 Relationship between Latitude and Income per Capita
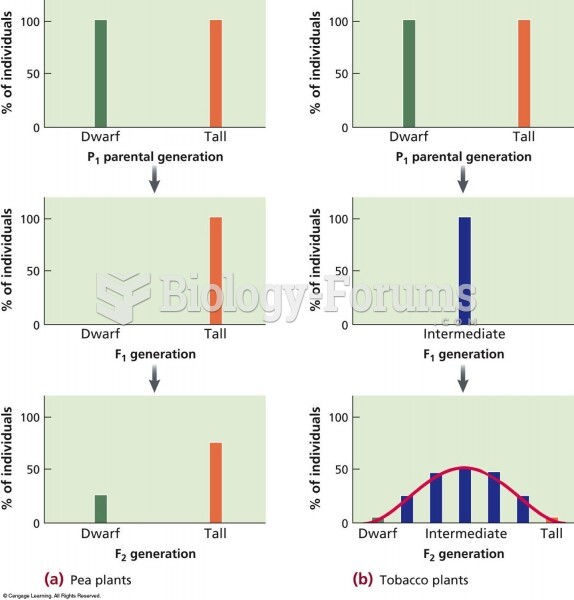 A comparison of a trait (height) that shows discontinuous and continuous phenotypes in different pla