The supply curve for watches
A) is downward sloping.
B) shows the relationship between the quantity of watches firms are willing and able to supply and the quantity of watches consumers are willing and able to purchase.
C) shows the supply of watches consumers are willing and able to buy at any given price.
D) shows the relationship between the price of watches and the quantity of watches supplied.
Question 2
Refer to Figure 7-1. Marginal social benefit is represented by which curve?
A) Supply
B) D1
C) D2
D) All of the above represent marginal social benefit.

 Steric relationship of the stereoisomers of alanine to the absolute configuration of L
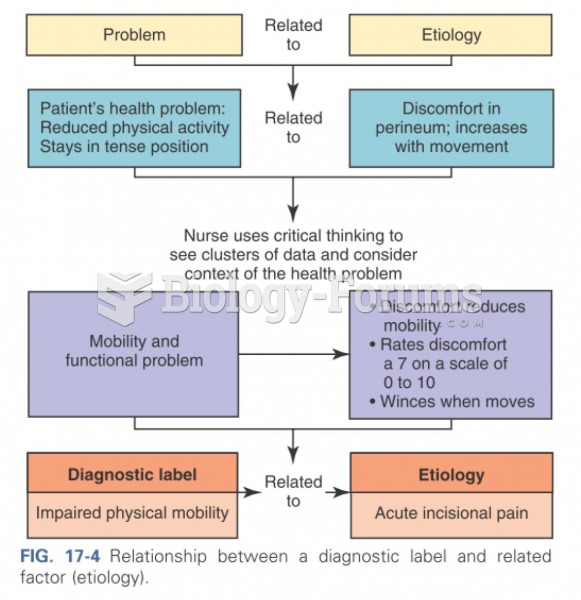 Relationship between a diagnostic label and related factor
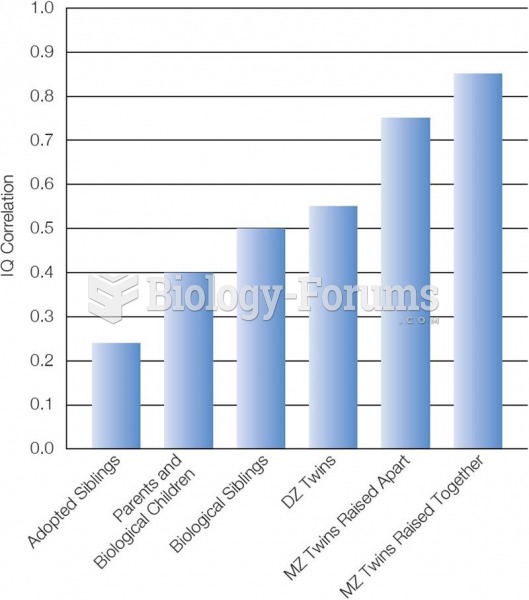 IQ and Genetics The closer the genetic relationship, the higher the correlation in IQ. Based on: Br
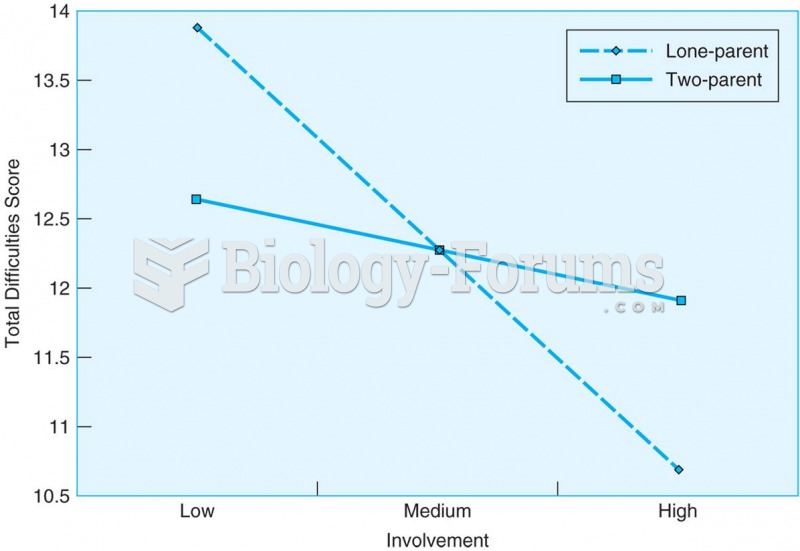 When teenagers live in single-parent homes, a good relationship with grandparents is related to ...
 Relationship between Income per Capita and Population Growth
 The slope of the curve y = ax^3 - bx^2 + cx - 3 at x = 2 is 5. If the point of inflection of the cur