|
|
|

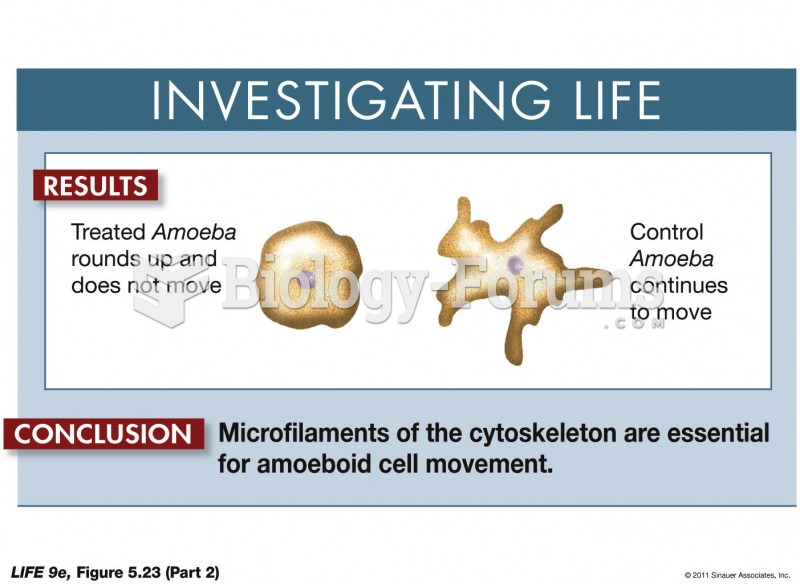 The Role of Microfilaments in Cell Movement-Showing Cause and Effect in Biology 2
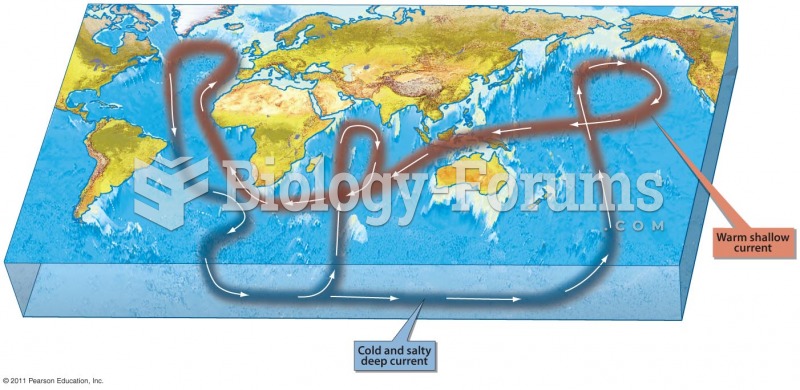 Movement of Water in the World Ocean
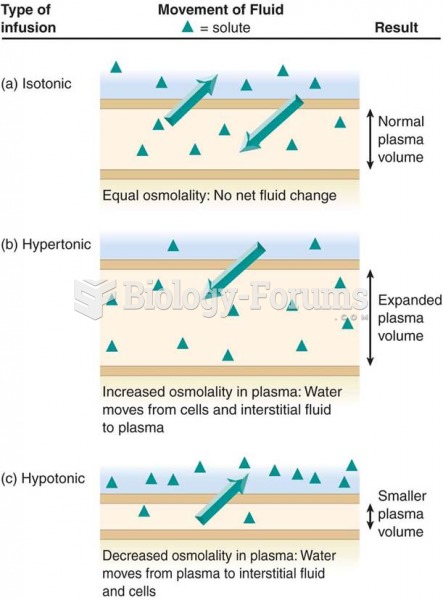 Movement of fluids and solution tonicity
 James Madison was a key figure at the Constitutional Convention of 1787 in Philadelphia. He not only
 Molecular Movement
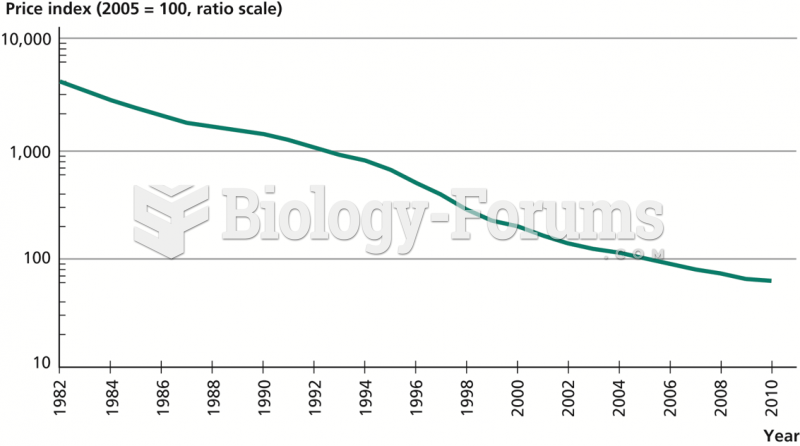 Price of Computers, 1982–2010