|
|
|

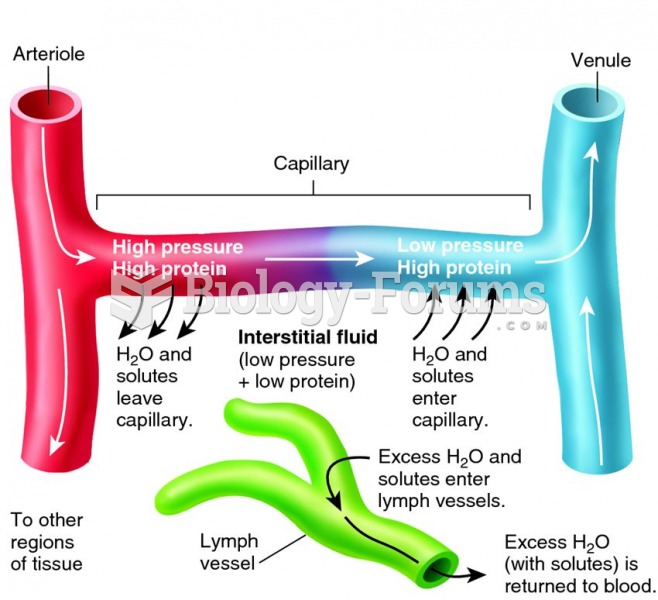 Water movement between capillaries and interstitial fluid.
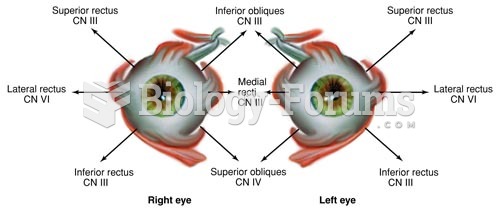 Direction of Movement of Extraocular Muscles
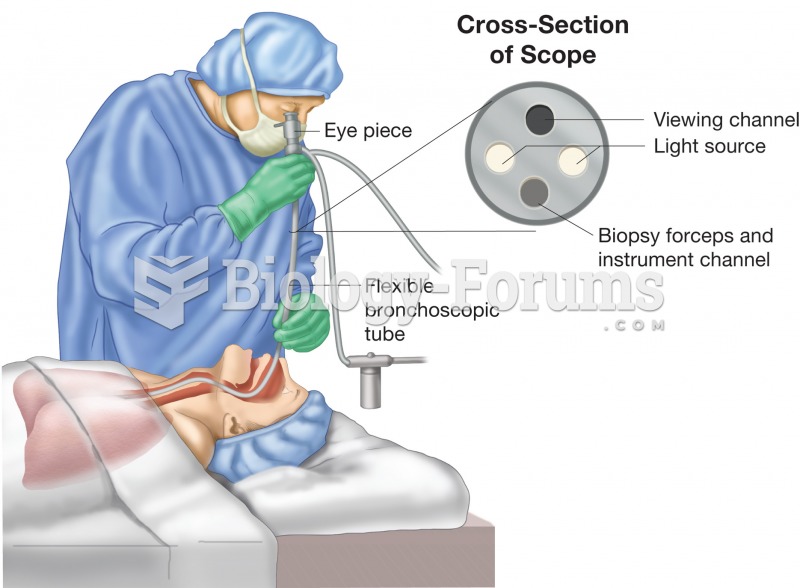 Bronchoscopy. Figure illustrates physician using a bronchoscope to inspect the patient’s bronchial t
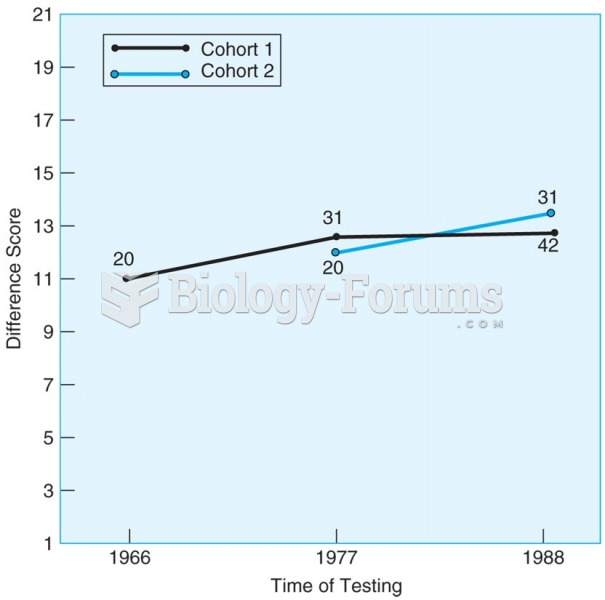 Mean scores for Erikson’s stage VI (Intimacy) for two cohorts. Scores for both cohorts increase ...
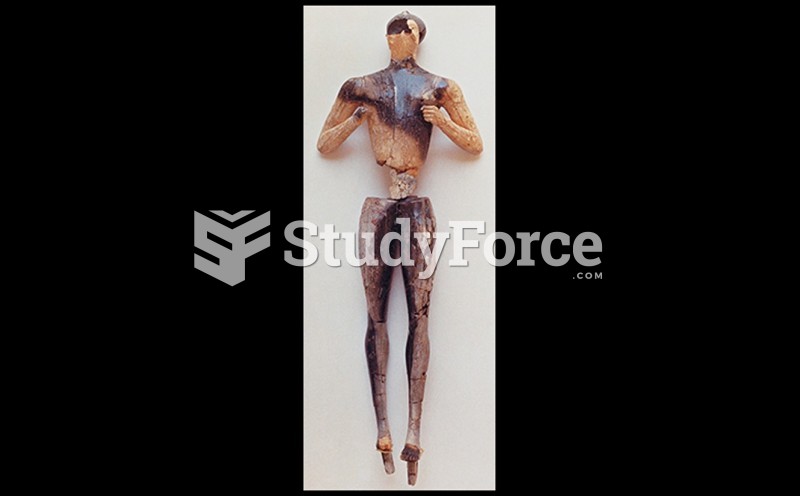 Statuette of a Male Figure
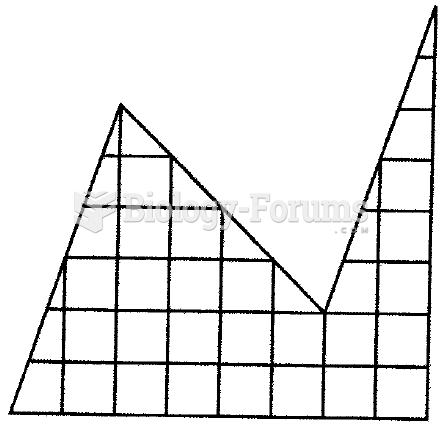 Cut the figure into two identical parts