The above figure shows the marginal benefit and marginal cost curves for a public good. The quantity that has the best prospect of winning in an election by well-informed voters is
A) A.
B) B.
C) C.
D) zero units supplied.
Question 2
Along an indifference curve
A) the marginal rate of substitution is constant but not equal to zero.
B) the consumer does not prefer one consumption point to another.
C) the marginal rate of substitution is equal to 0.
D) the consumer prefers some of the consumption points to others.

 Good body mechanics when facing the table directly. A. Head and back in alignment. B. Legs and feet ...
 Figure of a Woman with a Drawing Showing Evidence of Original Painting and Outlining Design Scheme
 Perfect logistic curves
 Monitoring shows that many forms of air pollution have decreased
 The drum shown in the figure has a radius of 0.40 m and a moment of inertia of 2.3 kg m2about ...
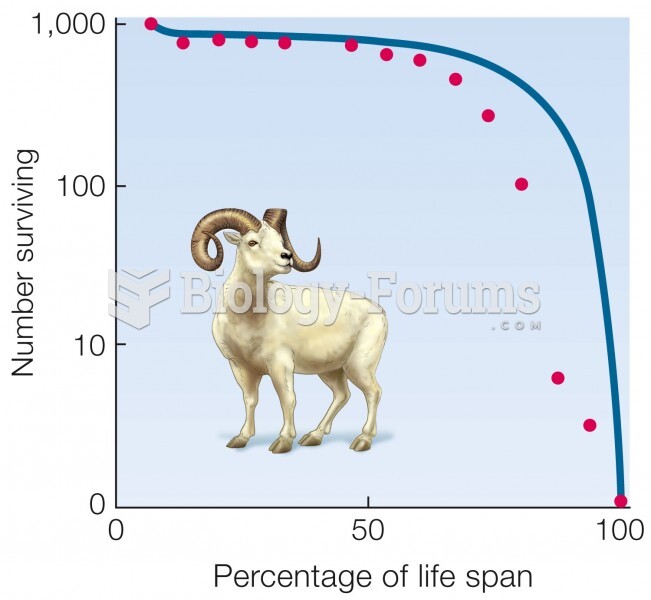 Survivorship curves.