This topic contains a solution. Click here to go to the answer
|
|
|

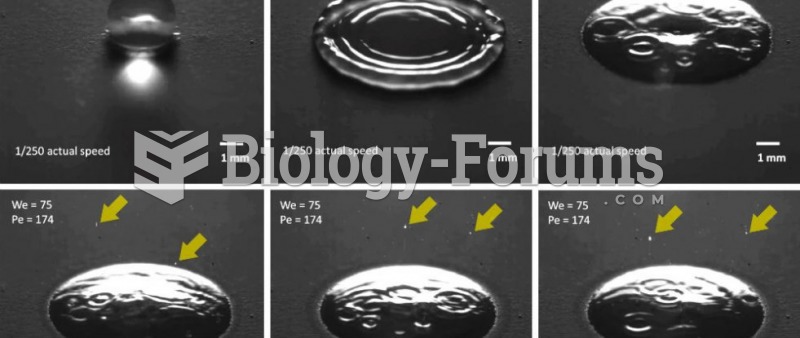 Raindrops release aerosols on impact
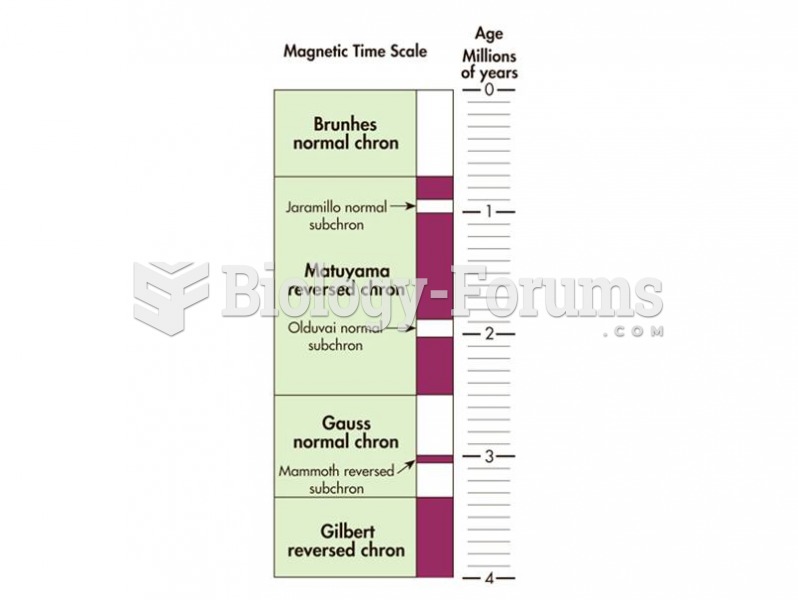 The geomagnetic polarity time scale shows how Earth’s magnetic pole has changed through geologic tim
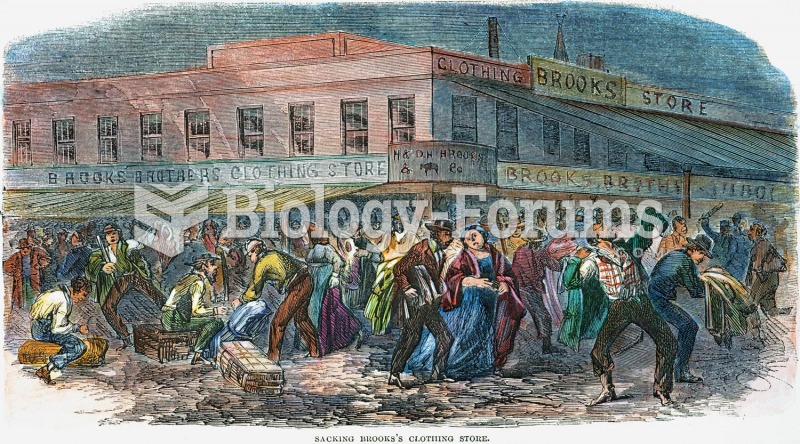 This lithograph of the New York draft riots, 1863, shows that although the rioters mainly targeted b
 Nonverbal communications convey strong, powerful messages that may be negative or positive.
 Move joints in hands. Apply scissoring to metacarpals and figure-8s to fingers.
 Picture graph