This topic contains a solution. Click here to go to the answer
|
|
|

 The end of a typical line wrench, which shows that it is capable of grasping most of the head of ...
 The end of a typical line wrench, which shows that it is capable of grasping most of the head of ...
 The Global Impact of Climate Change
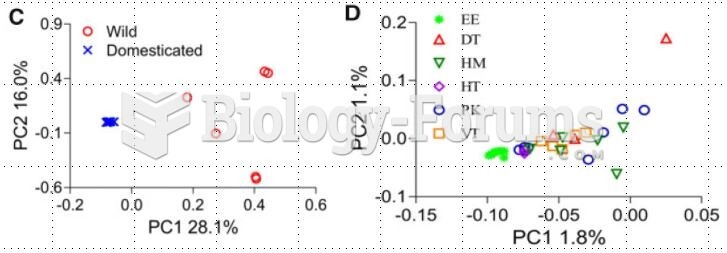 graph
graph
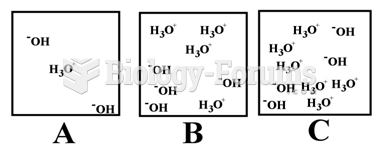 Which of the above illustrations shows an acidic aqueous solution
 Section of a normal brain (left) and an HD brain (right). The HD brain shows extensive damage to the