|
|
|

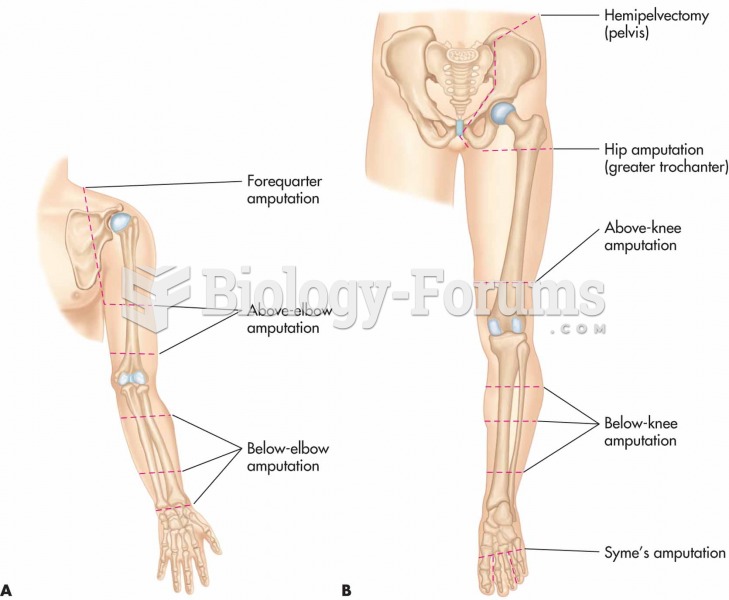 Common sites of amputation. (A) Upper extremities. (B) Lower extremities. The surgeon determines th
 Blocked at every turn by congressional Republicans who hated him, President Obama turned to techniqu
 Find the factor demand for labour and the amount of output it will produce. Show all ...
 Frequency distribution of phenotypes from the possible offspring in Figure 5.7. Height of the offspr
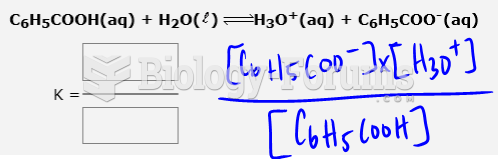 Write equilibrium constant expressions for the following reactions in terms of concentration:
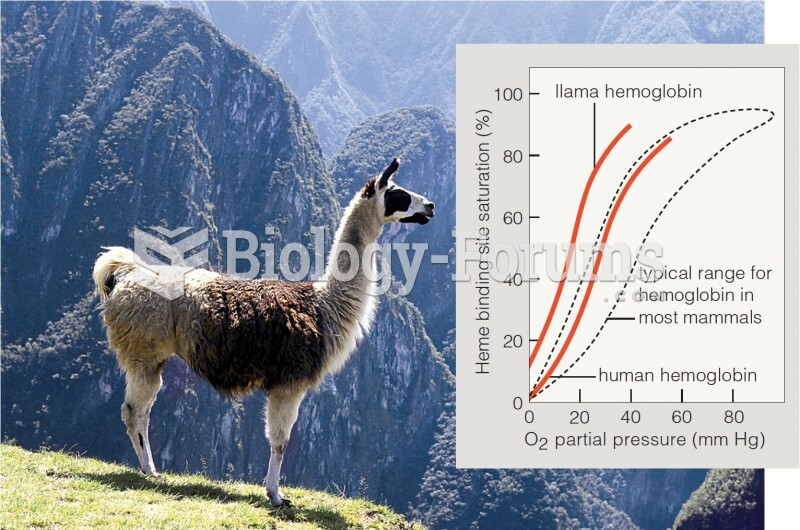 Saturation curve for hemoglobin of humans, llamas, and other mammals.