|
|
|

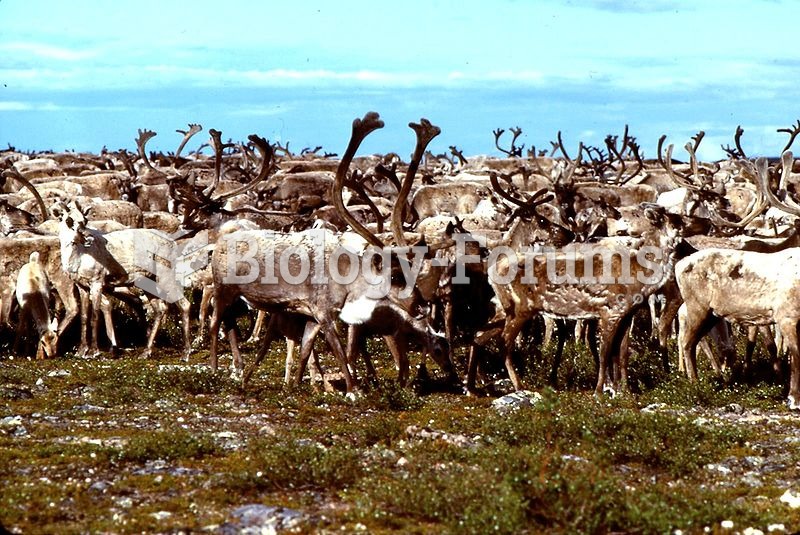 A herd of barren-ground caribou at the Thelon River. This subspecies is a long-distance migrant
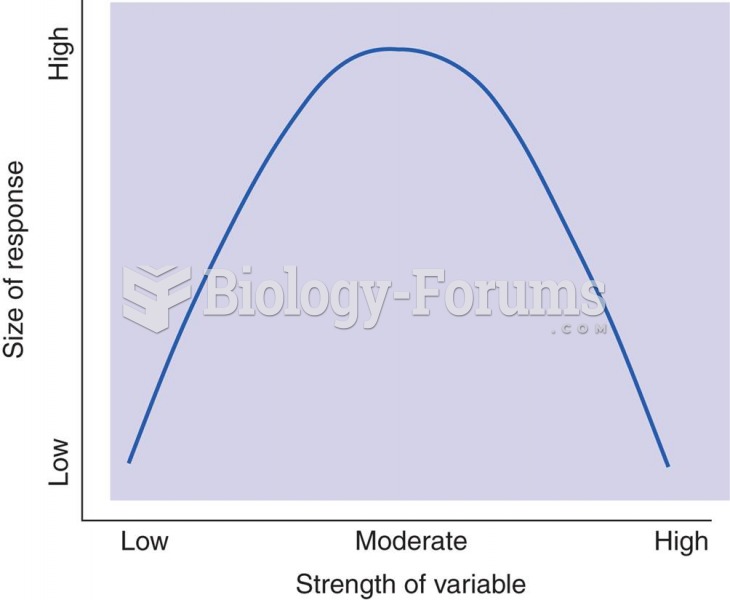 An Inverted U Curve
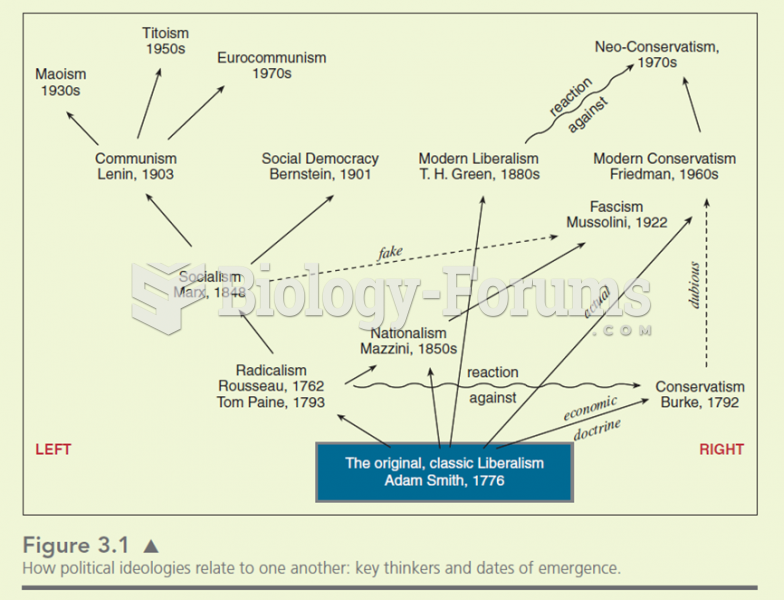 Many ideologies stem from older theories. The ideas of the philosophers are simplified. Ideologies
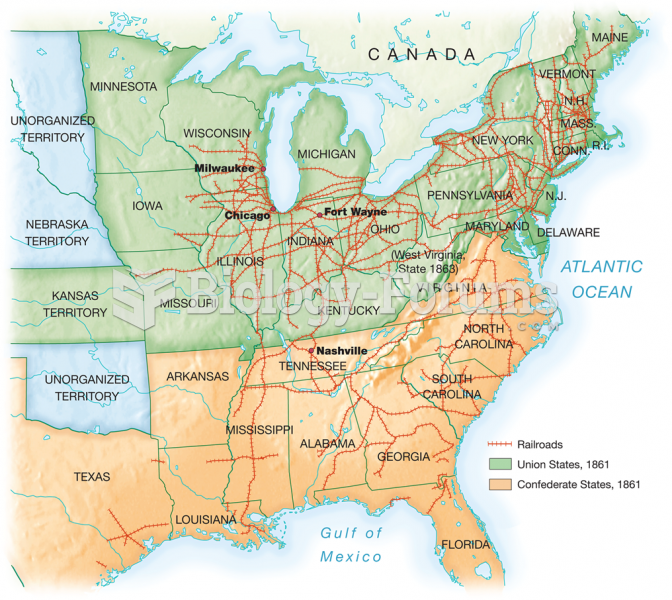 Major trunk lines carrying long-distance traffic crisscrossed the area east of the Mississippi. The
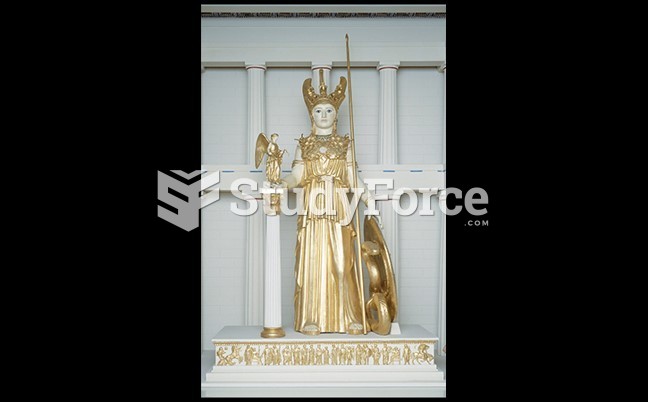 Re-creation of Pheidias’s Huge Gold and Ivory Figure of Athena
 Aggregate Fruits: Blackberry