This topic contains a solution. Click here to go to the answer
|
|
|

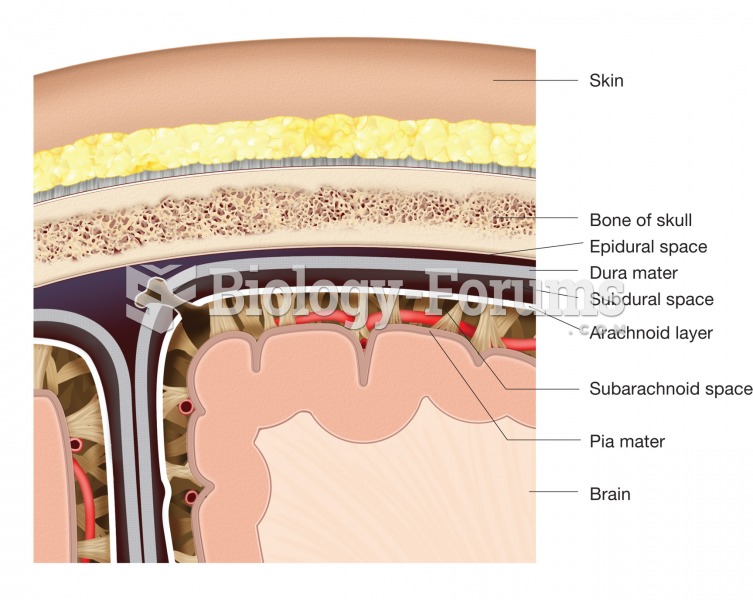 The meninges. This figure illustrates the location and structure of each layer of the meninges and t
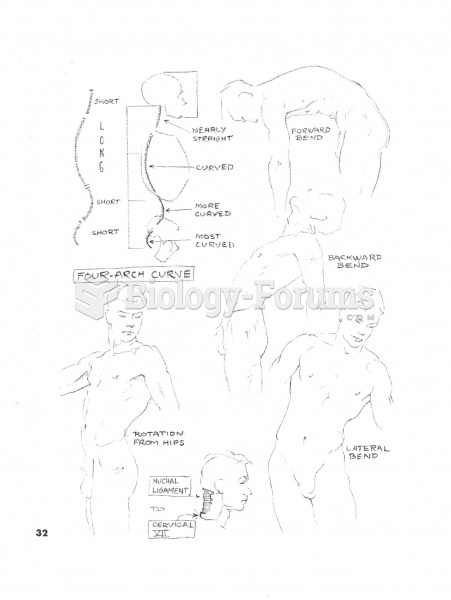 Four Arch Curve
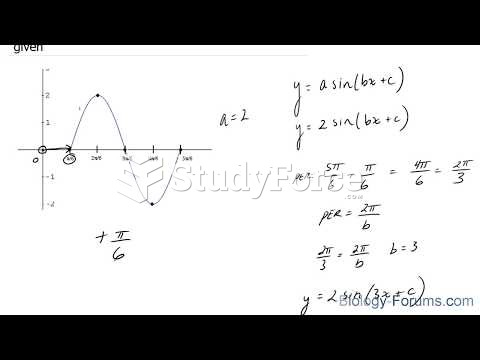 How to create a sine equation when the curve is given
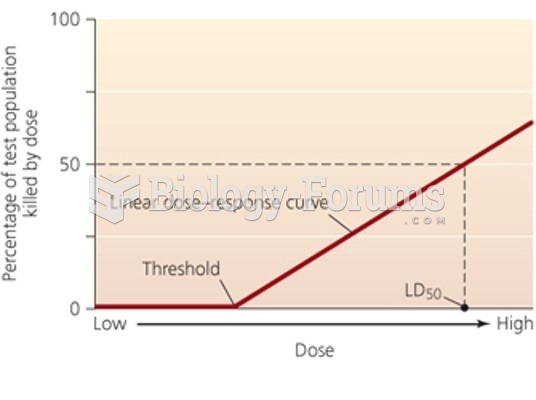 Dose-response curve with threshold
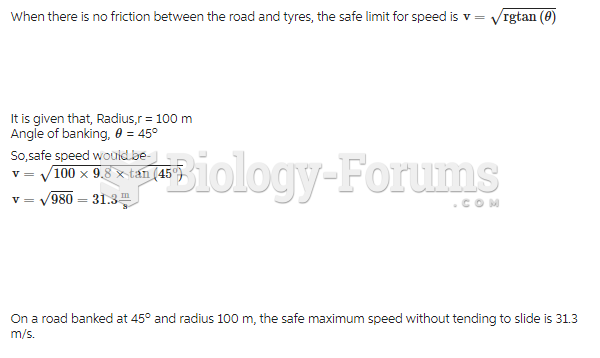 A highway curve of radius 80 m is banked at 45°. Suppose that an ice storm hits, and the ...
 Bayesian Analysis of the Genotype of II-2 in Figure A.4