|
|
|

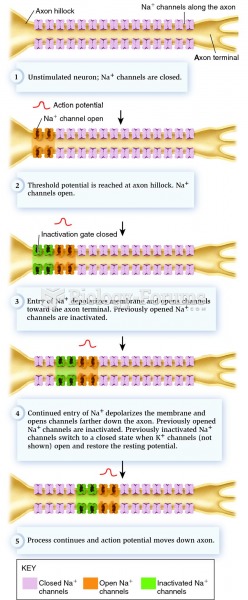 Conduction of the action potential along an axon.
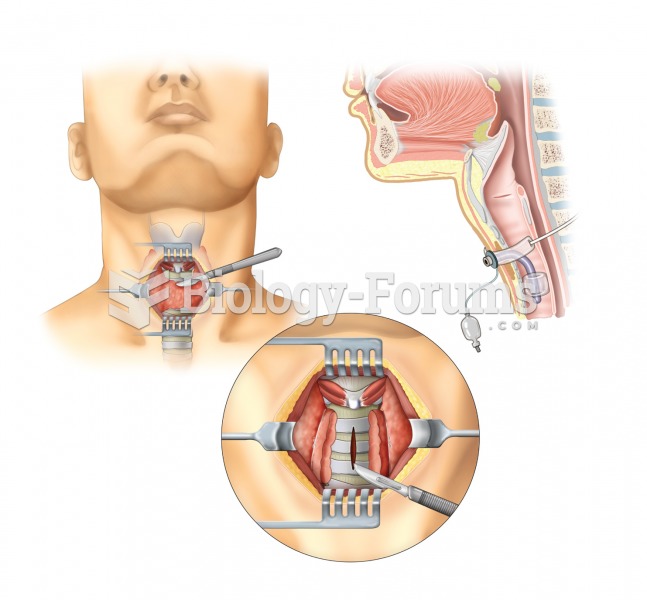 Tracheostomy. A tracheotomy, or incision into the trachea, is performed to create an opening into th
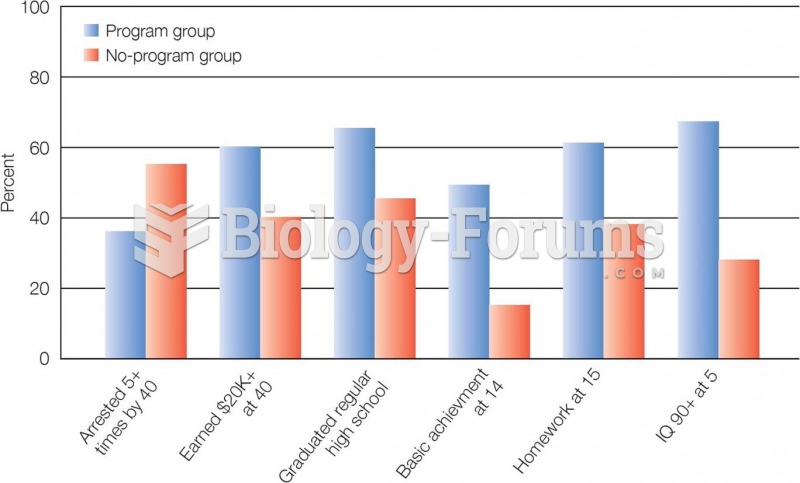 Major Findings of the High Scope Preschool Study High Scope participants showed better academic per
 PV cells have potential for domestic and commercial use
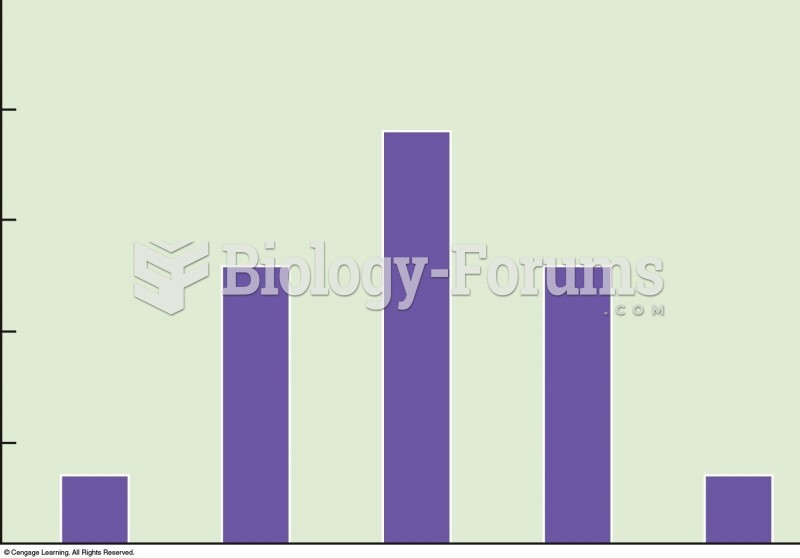 Frequency distribution of phenotypes from the possible offspring in Figure 5.7. Height of the offspr
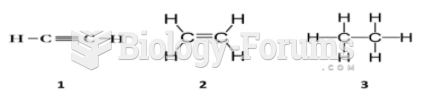 Which of the 3 structures shown below has the shortest bond length? Justify your answer.