|
|
|

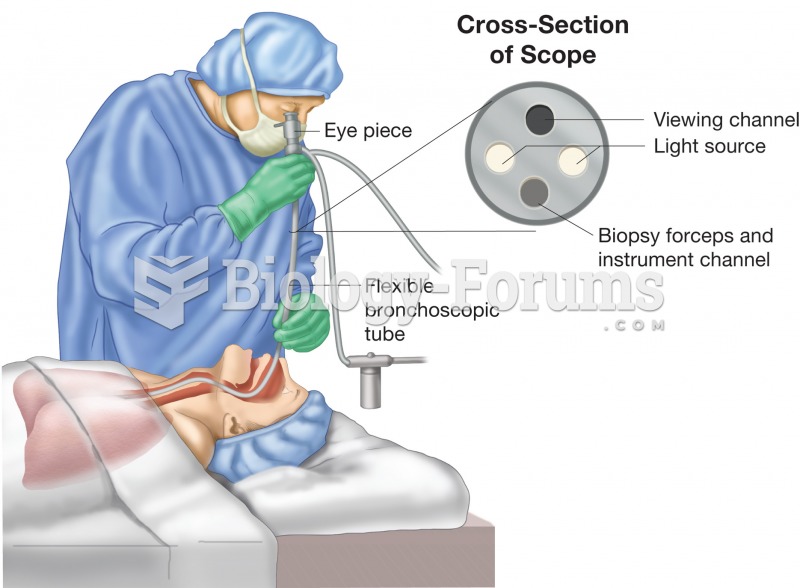 Bronchoscopy. Figure illustrates physician using a bronchoscope to inspect the patient’s bronchial t
 The Kingsley plantation, on Fort George Island in Jacksonville, Florida. Zephaniah Kingsley, the own
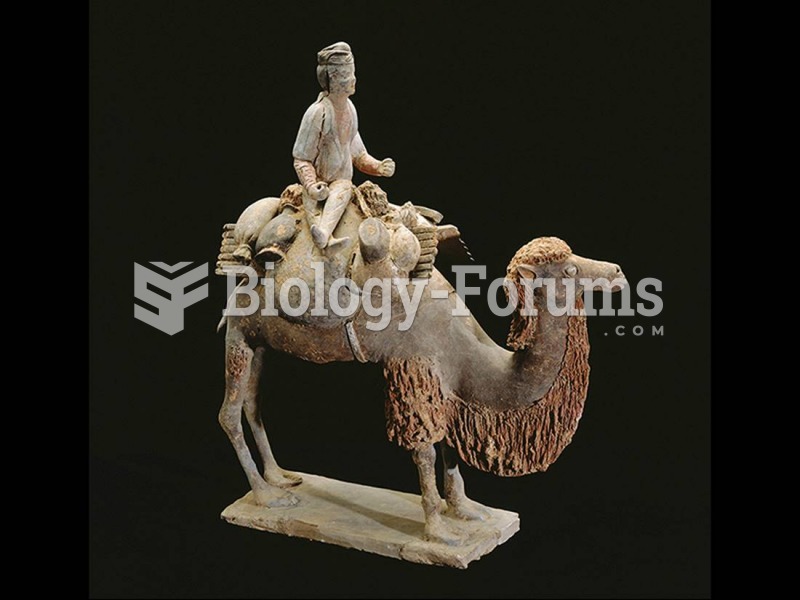 Caravaneer on a camel, China. Tang dynasty, (618–907). Polychrome terra-cotta figure.
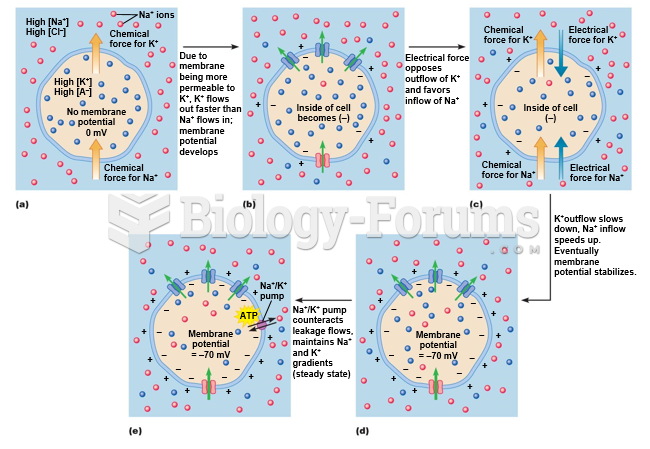 Establishing a steady-state resting membrane potential.
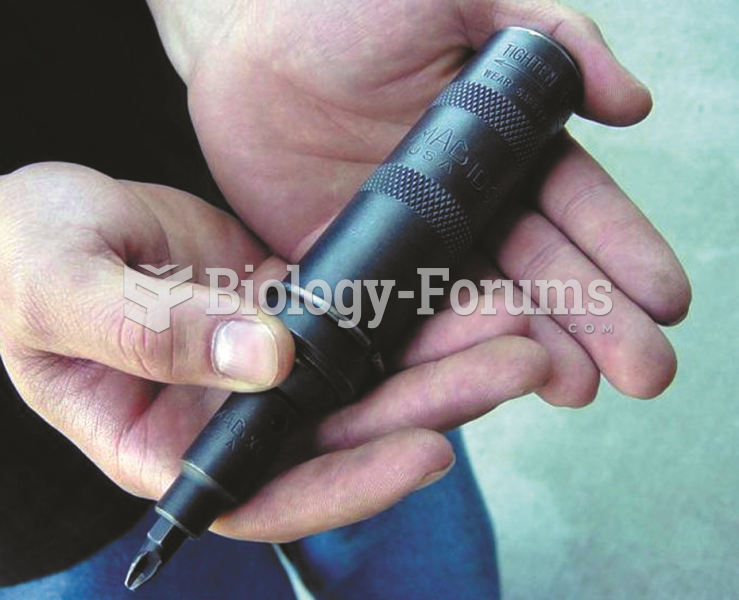 An impact screwdriver used to remove slotted or Phillips head fasteners that cannot be broken loose ...
 Synaptic transmission. (a) Action potential reaches synapse; (b) neurotransmitter released synaptic ...