In the figure above, the curve that shows the diminishing marginal utility is
A) total utility curve A because it gets steeper as consumption of tomatoes increases.
B) total utility curve A because it is higher than total utility curves B or C.
C) total utility curve C because it gets flatter as consumption of tomatoes increases.
D) total utility curve C because it is lower than total utility curves B and C.
Question 2
In the figure above, the marginal cost of producing a computer
A) increases as more computers are produced.
B) stays the same as more computers are produced.
C) decreases as more computers are produced.
D) is the same as the marginal cost of producing a television set.

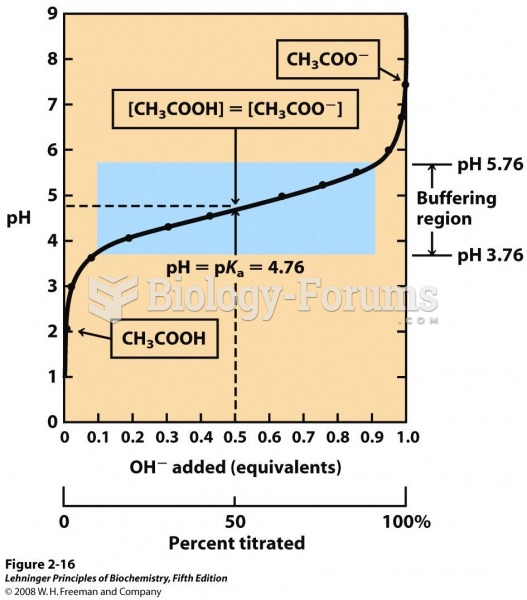 The titration curve of acetic acid
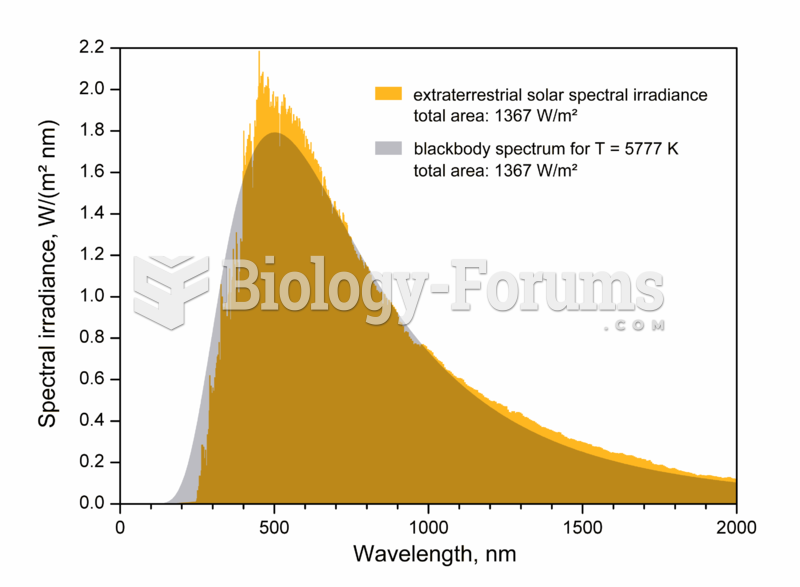 The effective temperature, or black body temperature, of the Sun (5777 K) is the temperature a black
 The graph shows the effect of sonic tuning of the intake manifold runners. The longer runners ...
 This label on a Toyota Camry hybrid shows the relative smog-producing emissions, but this does not ...
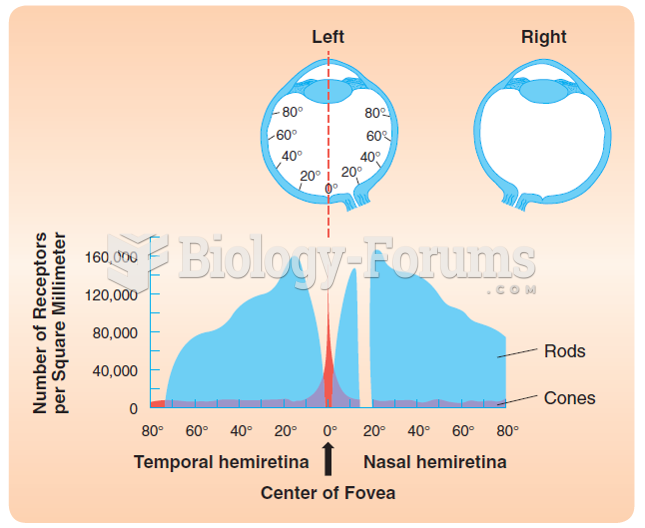 The distribution of cones and rods over the human retina. The figure illustrates the number of cones ...
 Refer to (d) in the figure above. This rectifier arrangement