|
|
|

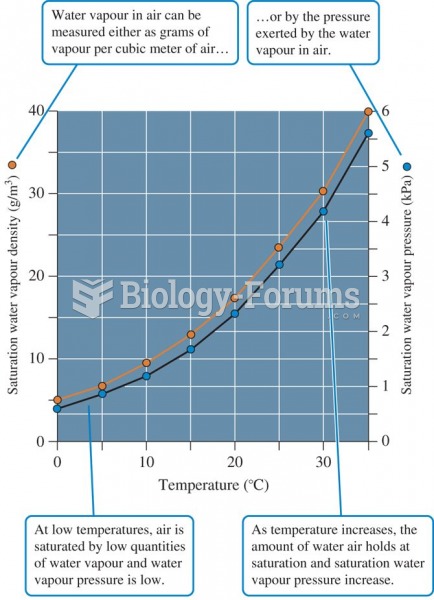 The relationship between air temperature and two measures of water vapour saturation of air.
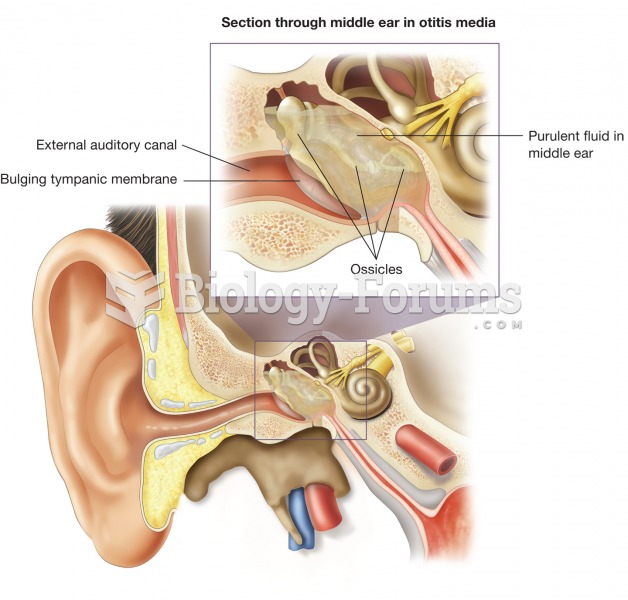 Otitis media. This illustration shows an inflamed tympanic cavity, which is the most common source o
 Results from sequential study of two cohorts tested at three ages and at three different points in t
 The relationship of substrate con- version (as measured by optical density) to the amount of patient ...
 Which of the following reactions correctly shows the transmutation of an element by neutron ...
 Meiosis is used to make sperm and egg cells. A shows a simplified version and B shows a detailed ver