|
|
|

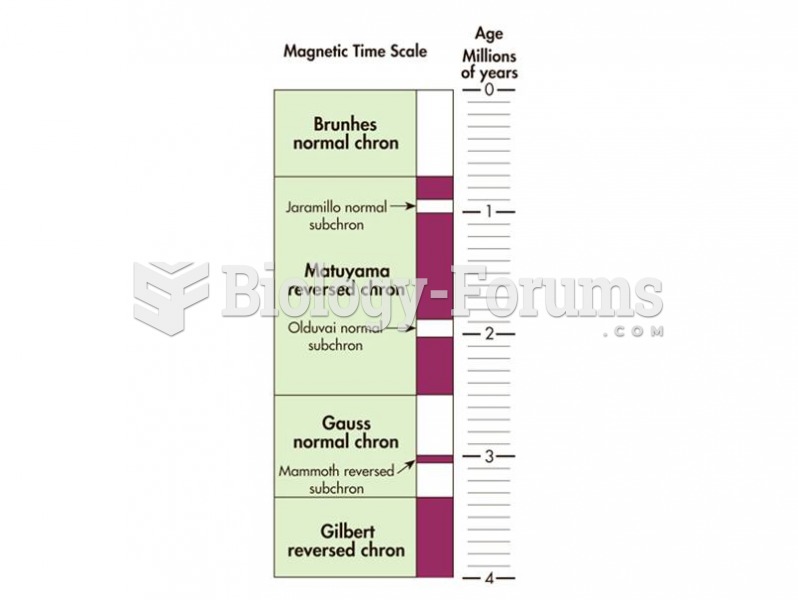 The geomagnetic polarity time scale shows how Earth’s magnetic pole has changed through geologic tim
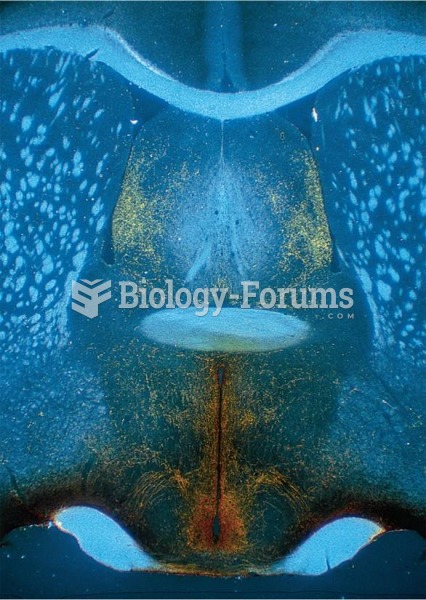 Localization of a Peptide The peptide is revealed by means of immunocytochemistry. The photomicrogra
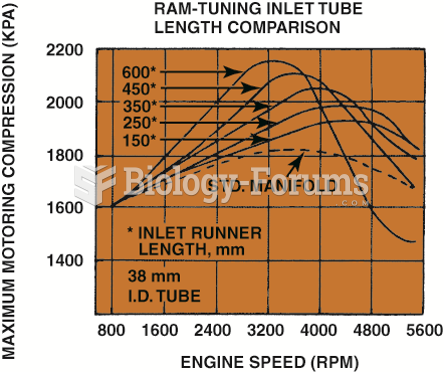 The graph shows the effect of sonic tuning of the intake manifold runners. The longer runners ...
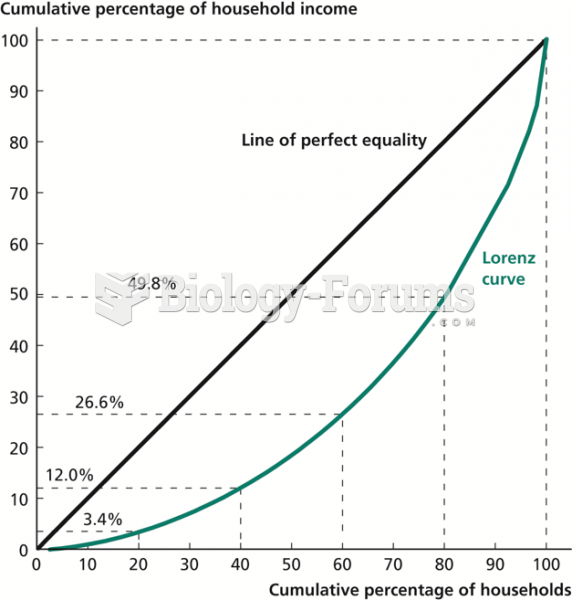 The Lorenz Curve for the United States, 2009
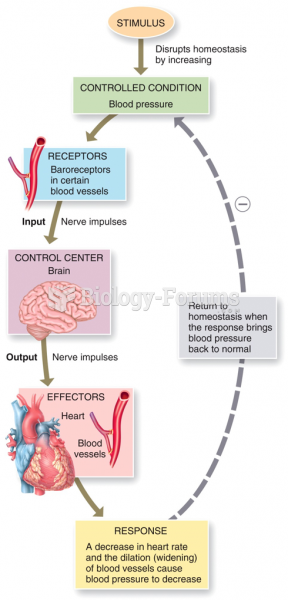 Control of Homeostasis: Negative Feedback
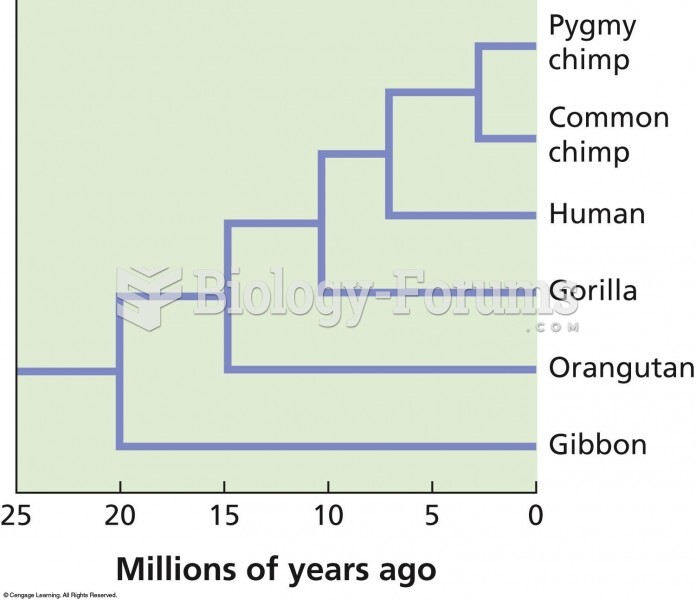 A phylogenetic tree showing the evolutionary relationships among hominoids. The evidence shows that