|
|
|

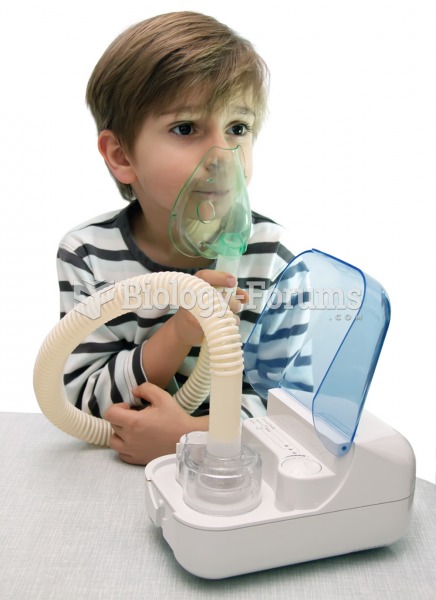 Nebulizer. The nebulizer converts a liquid medication to a mist that is easily inhaled. A face mask,
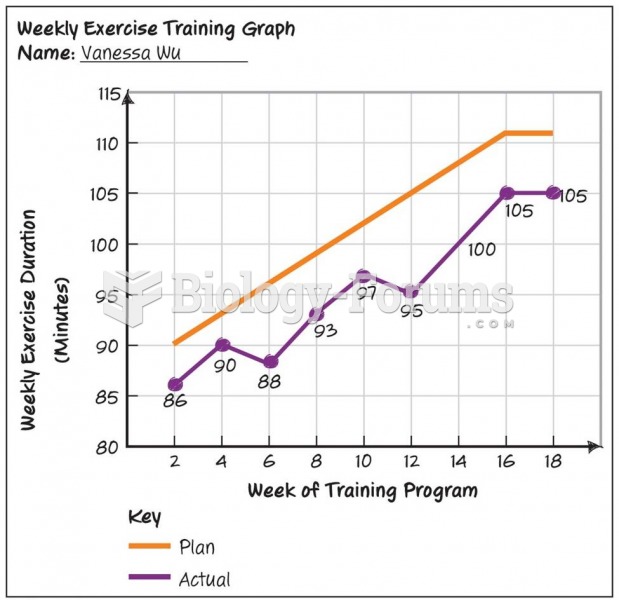 Progression Graph: Fitness Plan
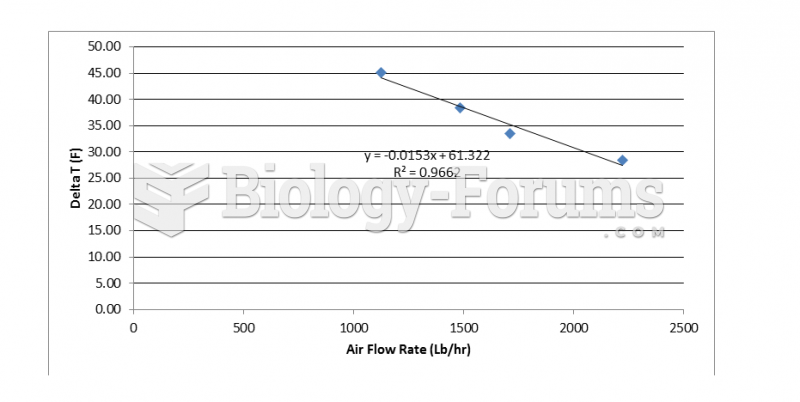 Change in air temperature at various air flow rates for a 2 pass operation
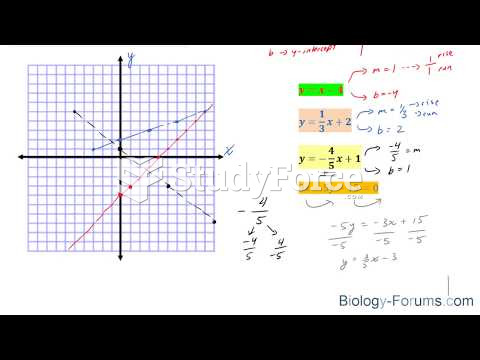 How to graph line equations without a table of values
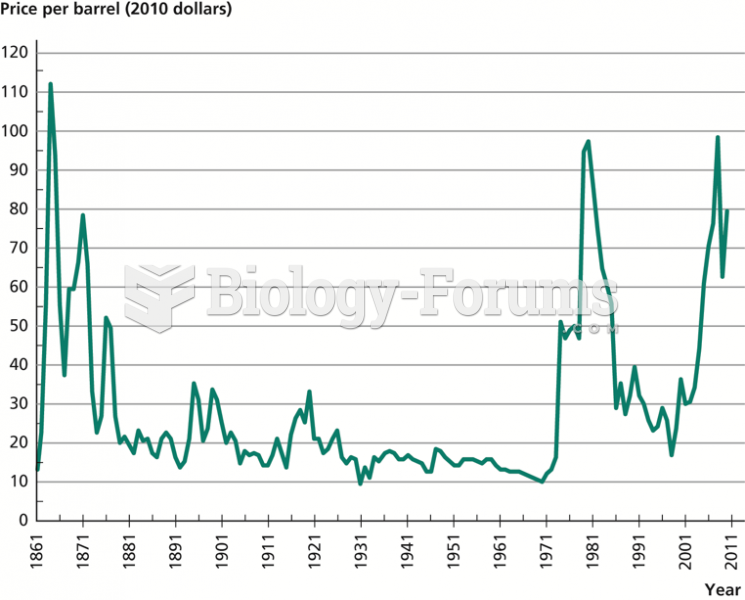 Real Price of Oil, 1861–2010
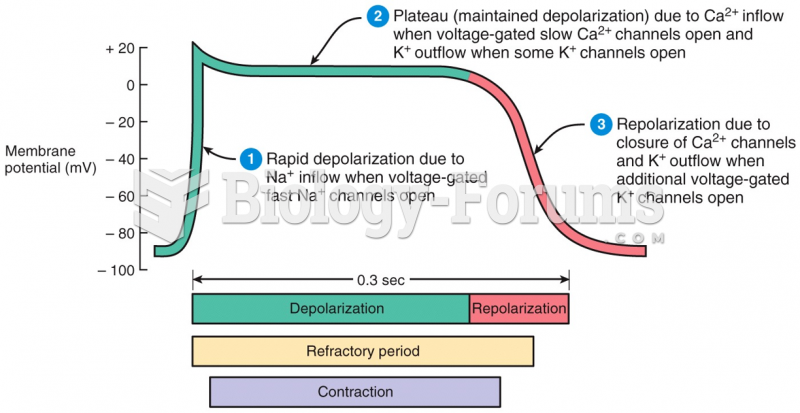 Action Potential in a Ventricular Fiber