This topic contains a solution. Click here to go to the answer
|
|
|

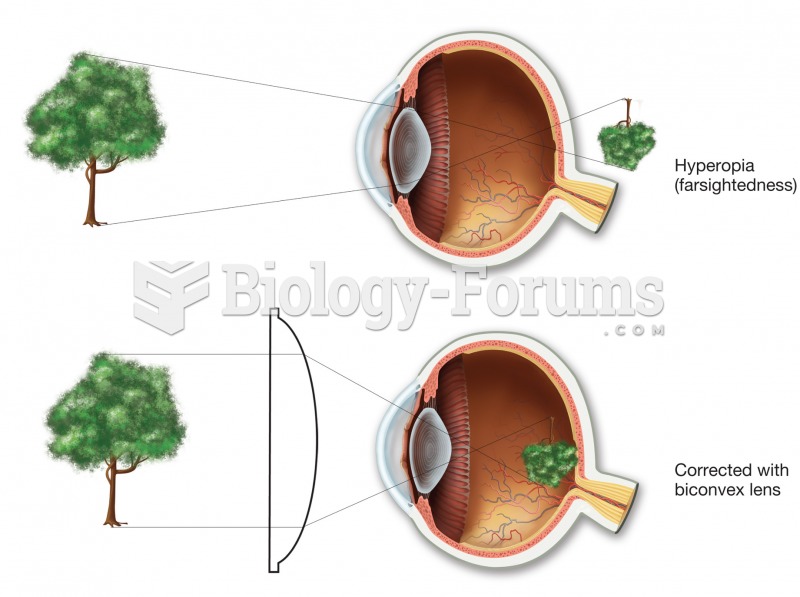 Hyperopia (farsightedness). In the uncorrected top figure, the image would come into focus behind th
 The “first wave” of the U.S. women’s movement met enormous opposition. The women in this 1920 ...
 Increase in Obesity among U.S. Children and Adolescents
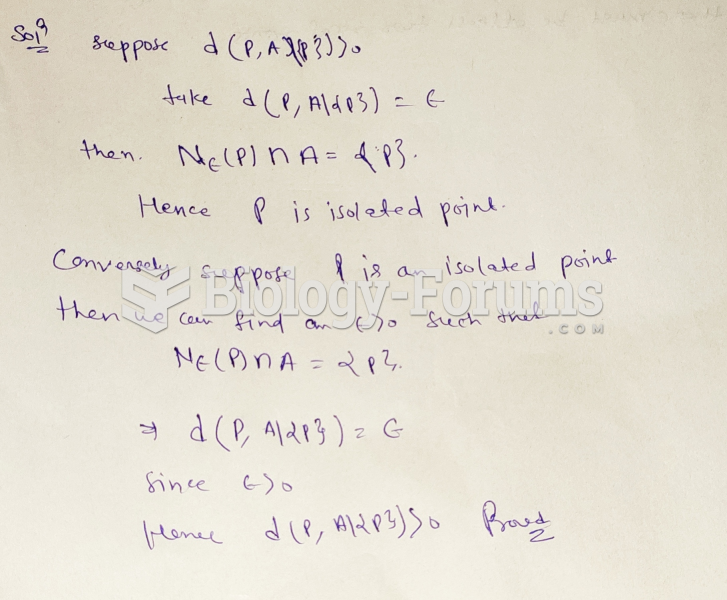 Let A ⊆ R and p ∈ A. Suppose A\{p}6= ∅. Prove that p is an isolated point of A if and ...
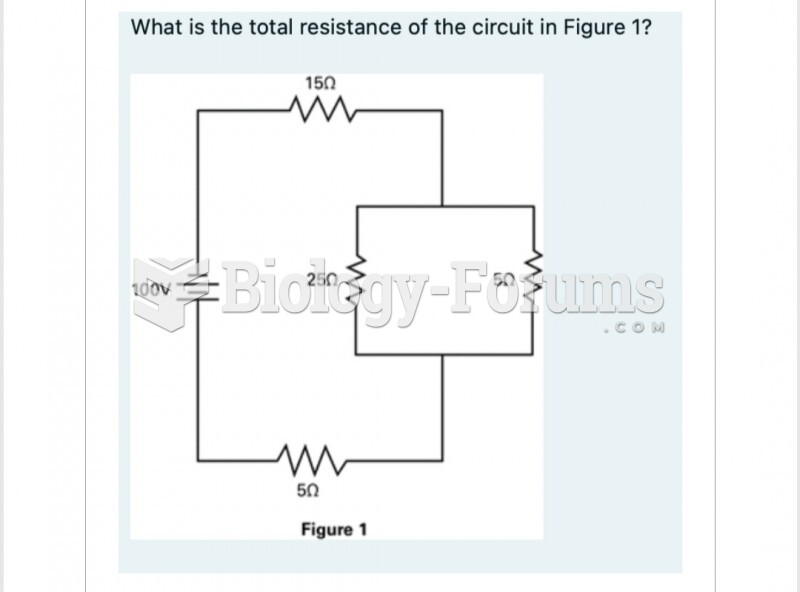 What is the total resistance of the circuit in Figure 1? 150
 Lod Score Values for the Families in Figure 5.15