This topic contains a solution. Click here to go to the answer
|
|
|

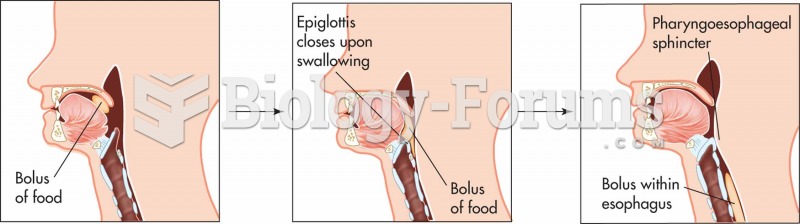 Movement of a bolus of food from the mouth to the esophagus. The bolus then travels to the stomach.
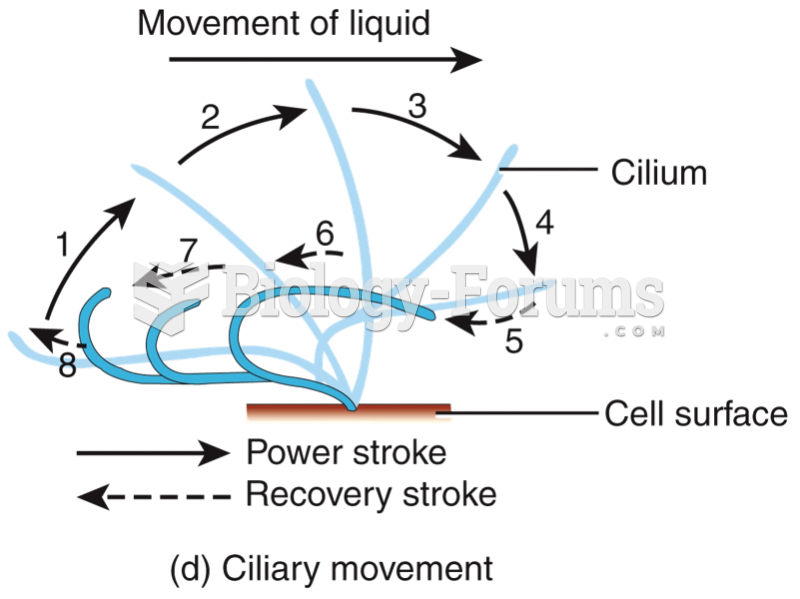 Ciliary movement
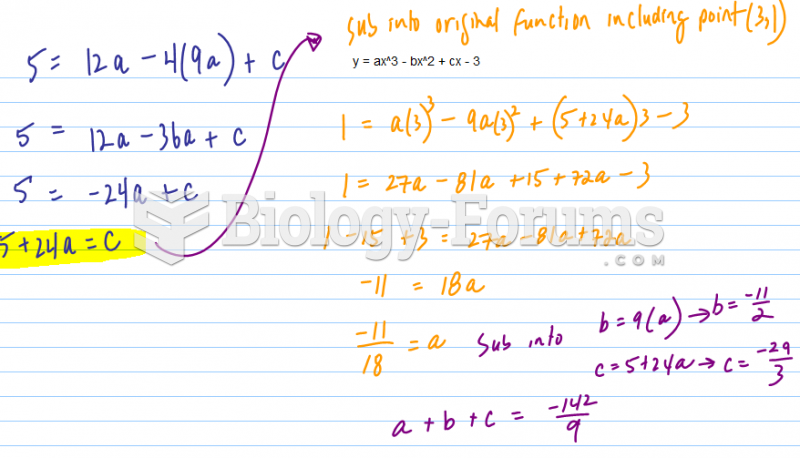 The slope of the curve y = ax^3 - bx^2 + cx - 3 at x = 2 is 5. If the point of inflection of the cur
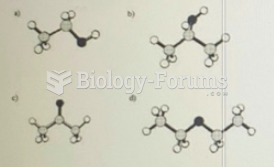 Ethanol has the molecular formula C2H6O. Which ball and stick model shown above represents ...
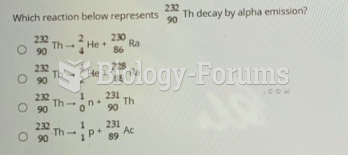 Which reaction below represents Th decay by alpha emission?
 Constructing a Three-Point Recombination Map