|
|
|

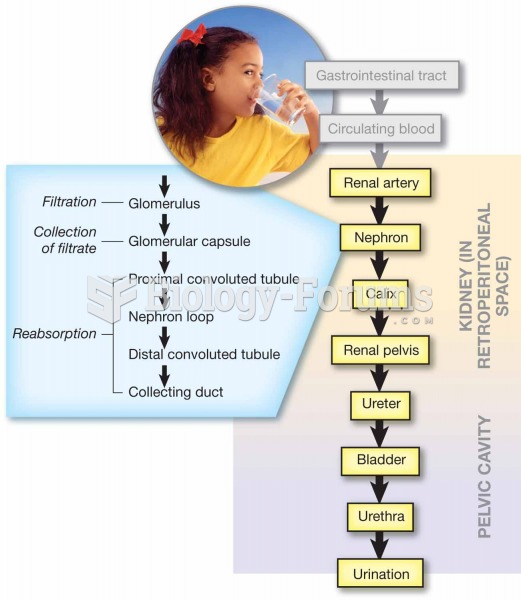 Pathway of urine production and elimination.
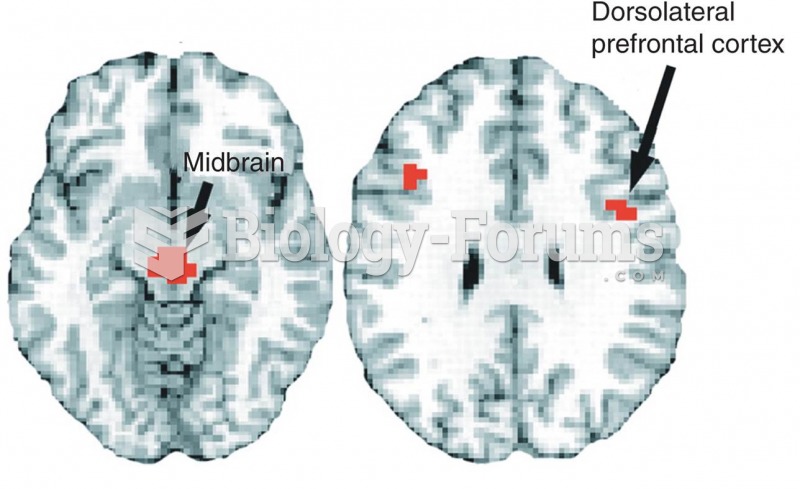 The Placebo Effect
 The age-related increase in spirituality is different for two cohorts born seven years apart. The ...
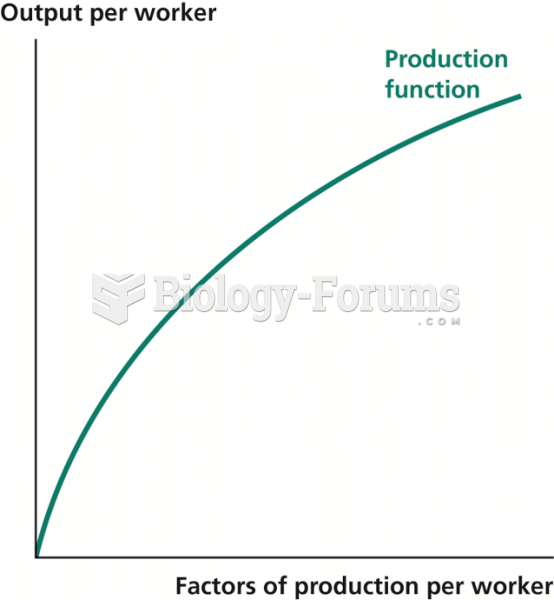 The Production Function
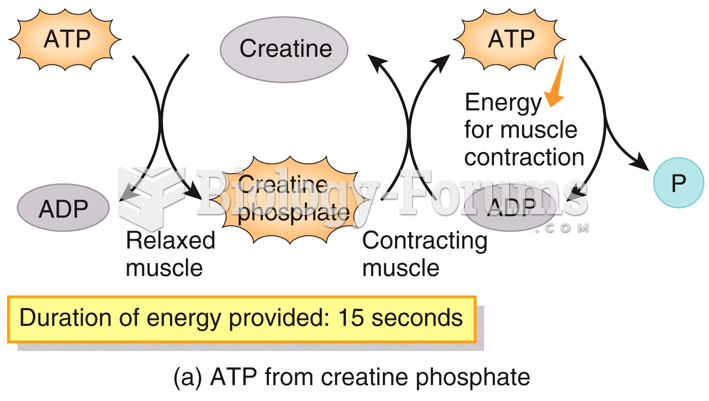 ATP Production in Cardiac Muscle
 graph
graph