In the above figure, what are the long-run equilibrium price level and real GDP?
A) 130 and 11.5 trillion B) 120 and 11.5 trillion
C) 120 and 12 trillion D) 130 and 12 trillion
Question 2
Which one of the following statements is TRUE?
A) Over the years, real consumption spending has been more volatile than real investment spending.
B) In the Keynesian model, changes in the volume of real investment spending are fully explained by changes in the real interest rate.
C) Domestic real investment in the United States was highest during the Great Depression.
D) Over the years, real investment spending has been more volatile than real consumption spending.

 Feng Mengbo, Long March: Restart.
 Ayurvedic massage. Long sweeping stroke from foot around shoulder and down the arm, recipient prone.
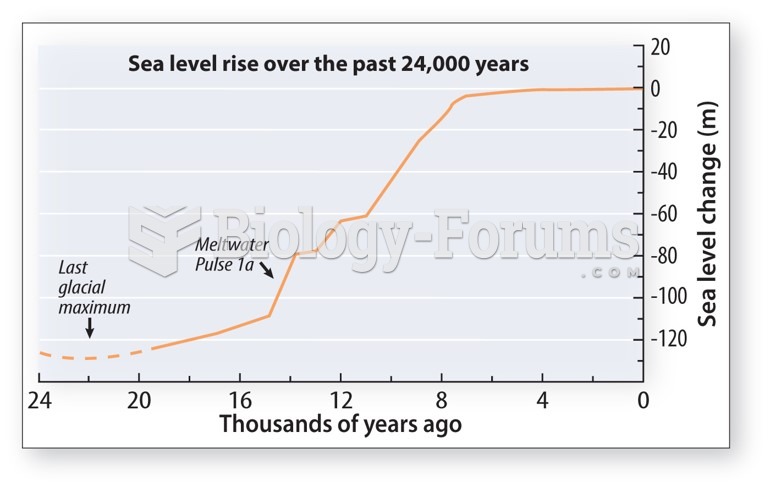 Rapid sea level rise
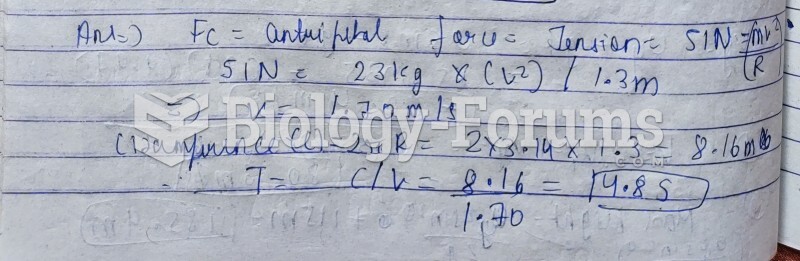 A 23 kg mass is connected to a nail on a frictionless table by a massless string 1.3 m long. ...
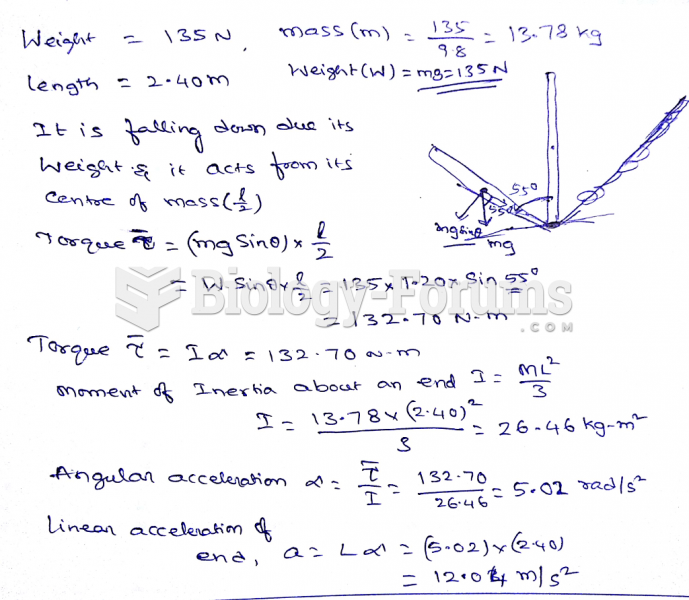 A very thin uniform rod, 2.40 m long and of weight 135 N, has a frictionless hinge at its lower ...
 Identify the junction nodes in the circuit shown in Figure 21-1.