From 2009 to 2012
A) The Beveridge curve became flat.
B) The Beveridge curve shifted to the right.
C) The Beveridge curve cannot be discerned in the data.
D) The Beveridge curve shifted to the left.
Question 2
If a person completely smooths consumption over his lifetime, then consumption is best represented by which of the following?
A) wealth / the number of years the person expects to live
B) lifetime income / the number of years the person expects to work
C) (wealth + lifetime income) / the number of years the person expects to live
D) (wealth + lifetime income) / the number of years the person expects to work

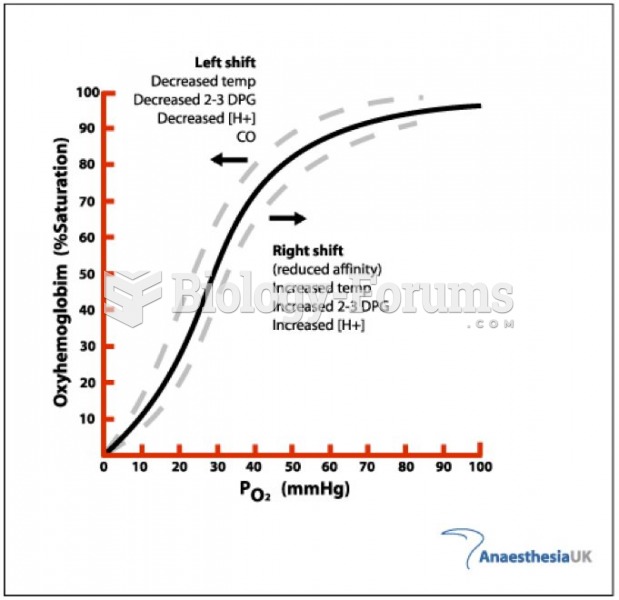 Oxygen dissociation curve
 Different hand positions and working surfaces for massage applications on large muscles. A. Flat ...
 Apply L strokes, using flat fingers, from temples to edge of mandible. Stretch is forward toward the ...
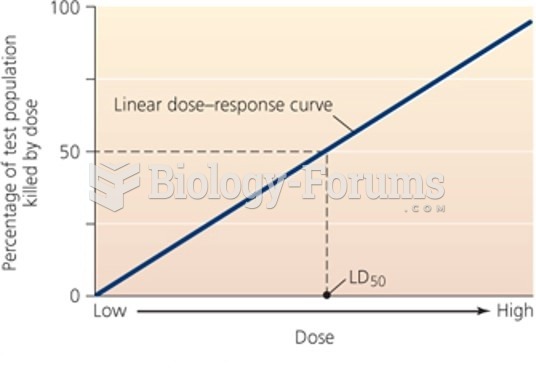 Linear dose-response curve
 Researchers and Research Spending, 2009
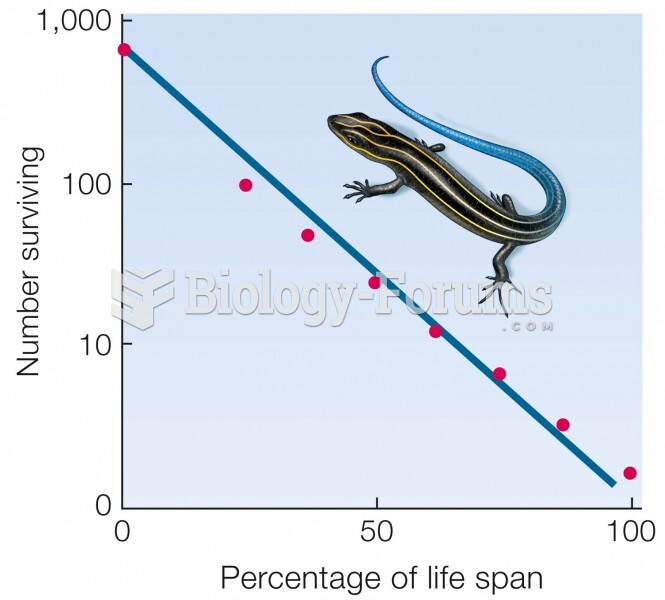 Type II curve. Mortality does not vary with age. Data for five-lined skink (Eumeces fasciatus).