Ron weighs 150 pounds. A graph relating Ron's weight on the vertical axis to Nancy's consumption of ice cream on the horizontal axis would be
a. a horizontal line at weight = 150
b. a horizontal line at weight = 0
c. a positively sloped line with decreasing slope
d. a vertical line at weight = 150
e. the origin
Question 2
Suppose a graph with Ron's weight on the vertical axis and his consumption of ice cream on the horizontal axis indicated that for each serving of ice cream he ate, Ron would gain 3 pounds, regardless of how much ice cream he had already eaten. This graph would show a
a. horizontal line at weight = 3
b. straight line with slope = 3
c. straight line with slope = 1/2
d. straight line with slope = -3
e. straight line with slope = -1/3

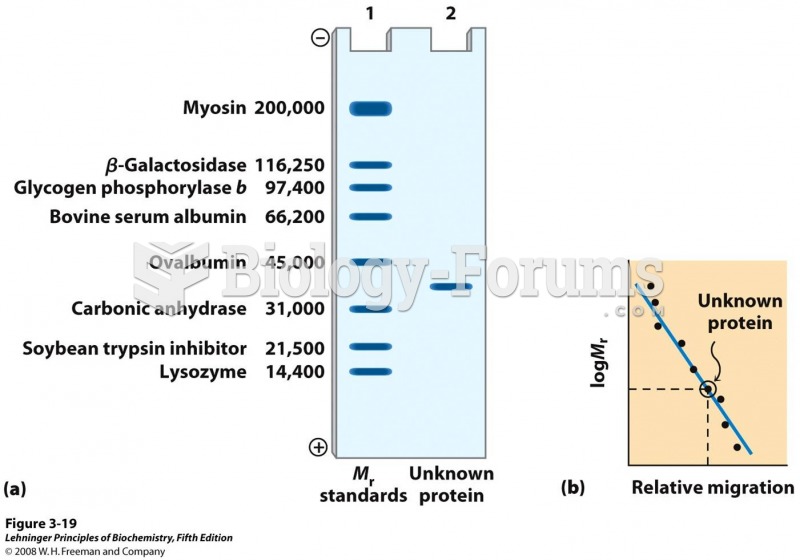 Estimating the molecular weight of a protein
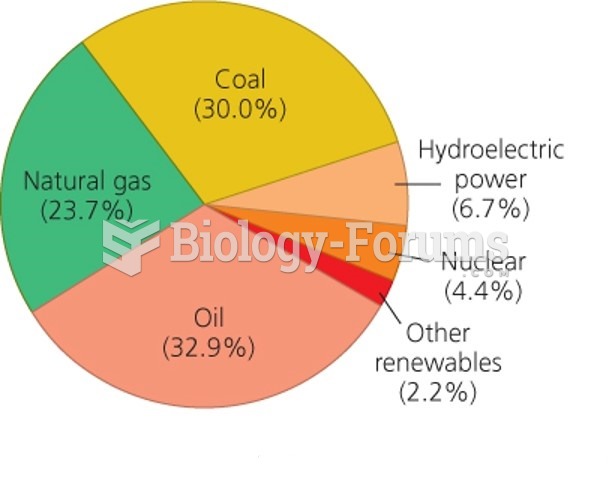 World Total Energy Consumption by Fuel Type
 Three Pieces of the Long-Term Weight-Loss Puzzle Diet
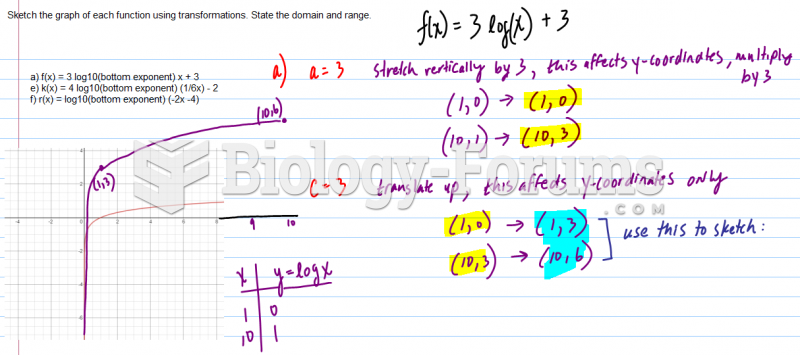 Sketch the graph of each function using transformations. State the domain and range.
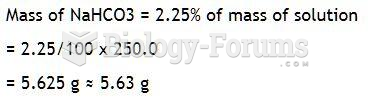 A solution is 2.25% by weight NaHCO3. How many grams of NaHCO3 are in 250.0 g of solution?
 Maternal bicoid patterning of the embryo along the anterior–posterior axis