This topic contains a solution. Click here to go to the answer
|
|
|

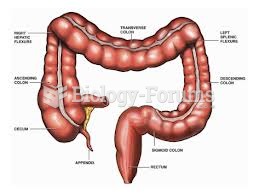 Large intestine
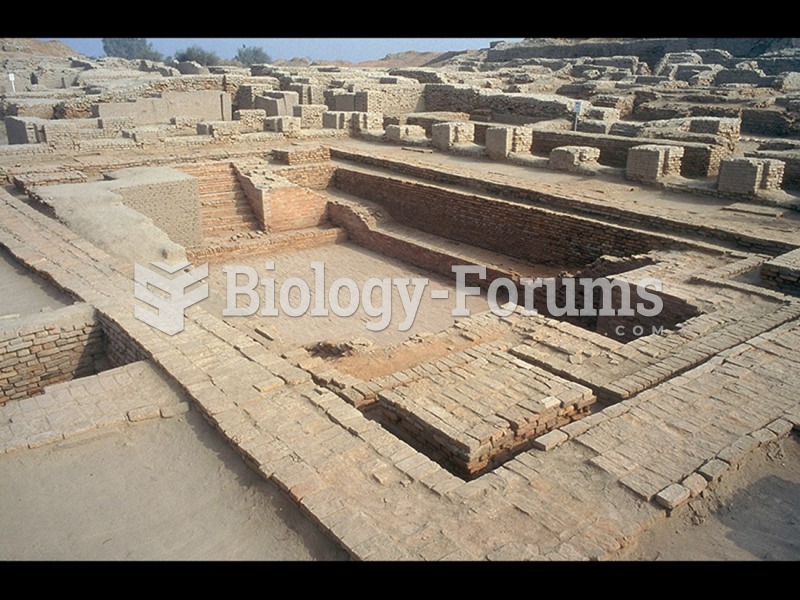 Large water tank, possibly a public or ritual bathing area, from Mohenjo-daro, Indus Valley ...
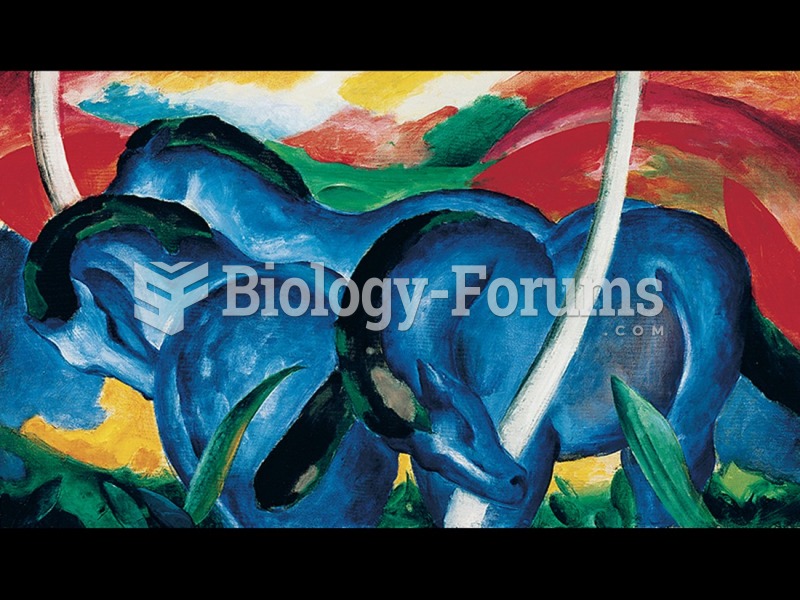 Franz Marc, Die grossen blauen Pferde (The Large Blue Horses).
 Plan of Trajan's Forum and Market "خطة منتدى ترجان والسوق"
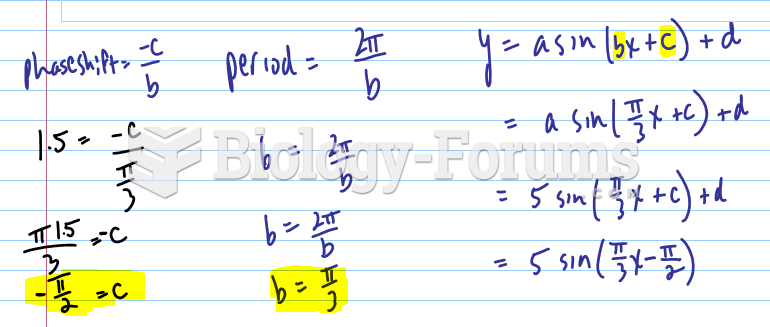 Sketch a graph of the function h(x), by hand on the following interval:
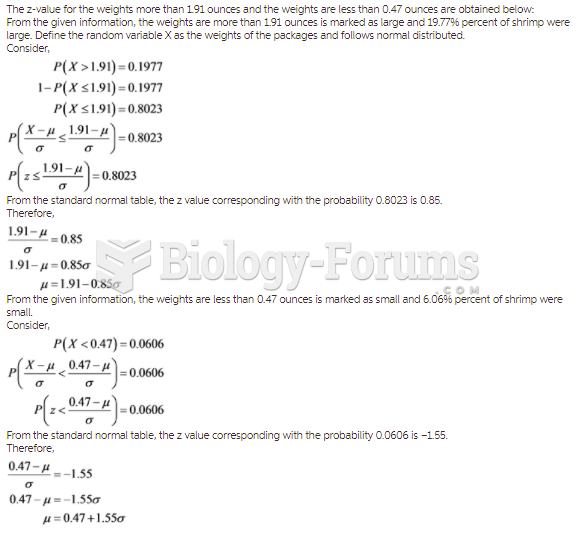 The Globe Fishery packs shrimp that weigh more than 1.91 ounces each in packages marked large ...