This topic contains a solution. Click here to go to the answer
|
|
|

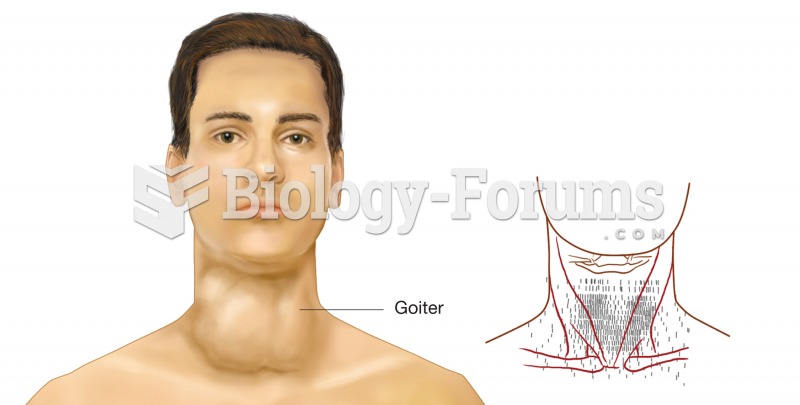 Thyroid scan. The right image is the data from a thyroid scan, printed on a superimposed map of the
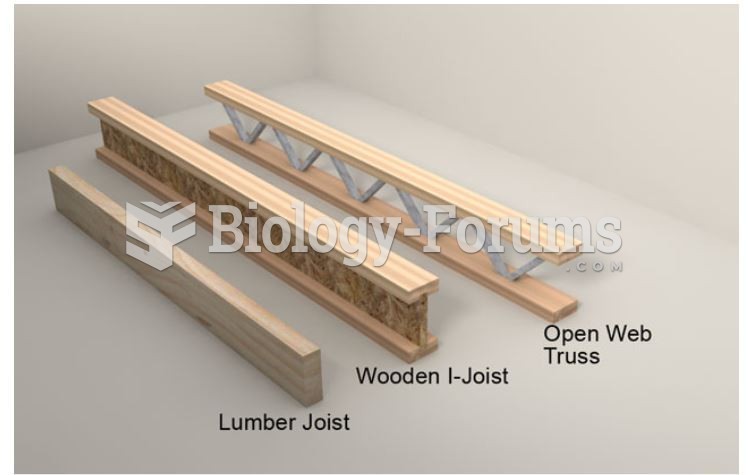 Primary Type of Floor Framing
 How to find the possible equations of a graph?
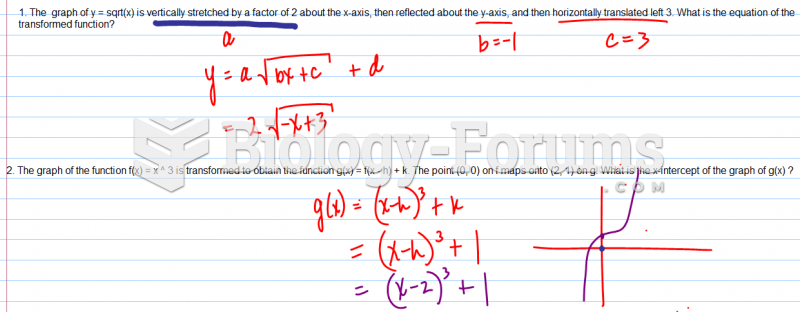 The graph of y = sqrt(x) is vertically stretched by a factor
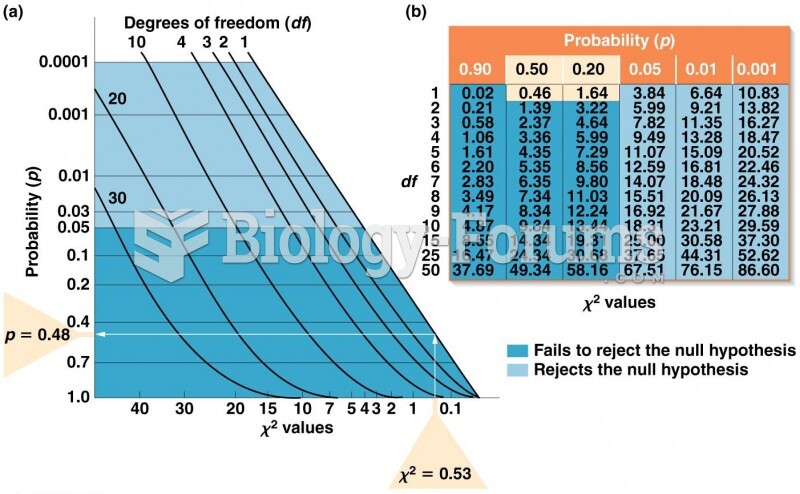 (a) Graph for converting values to p values. (b) Table of values for selected values of df
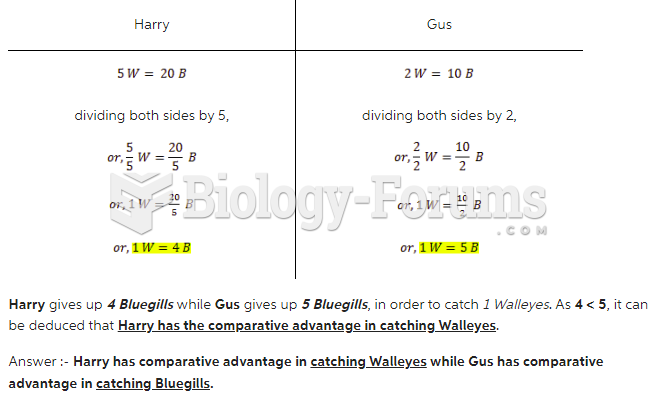 Harry and Gus fish the same lake together from the same boat. Each morning Harry typically ...