|
|
|

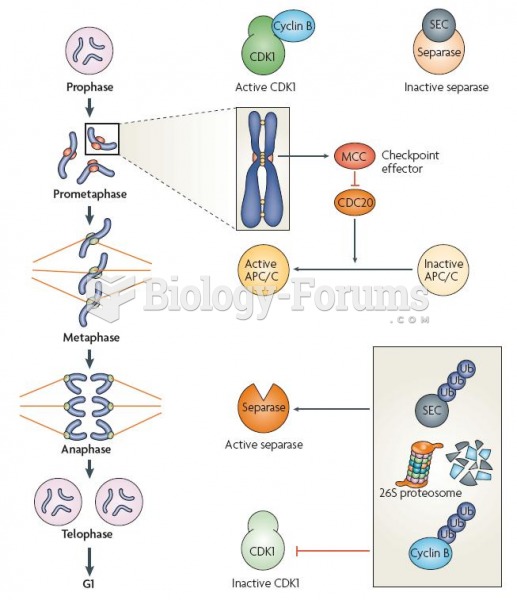 Relationship of the spindle-assembly checkpoint (SAC) with the cell-cycle machinery
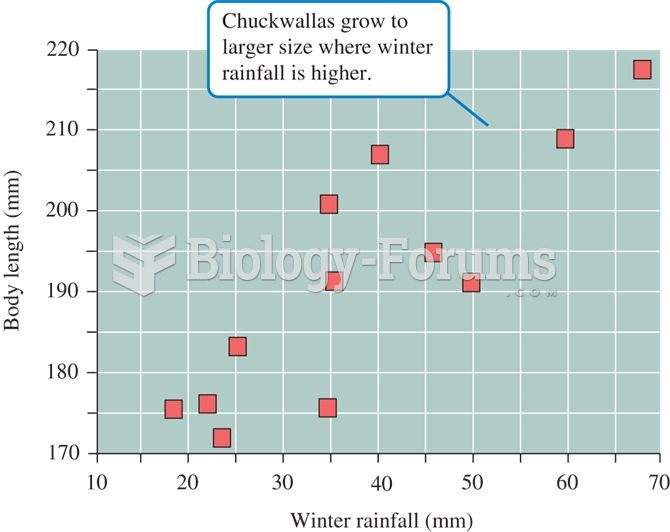 Relationship between winter rainfall and chuckwalla, Sauromalus, size
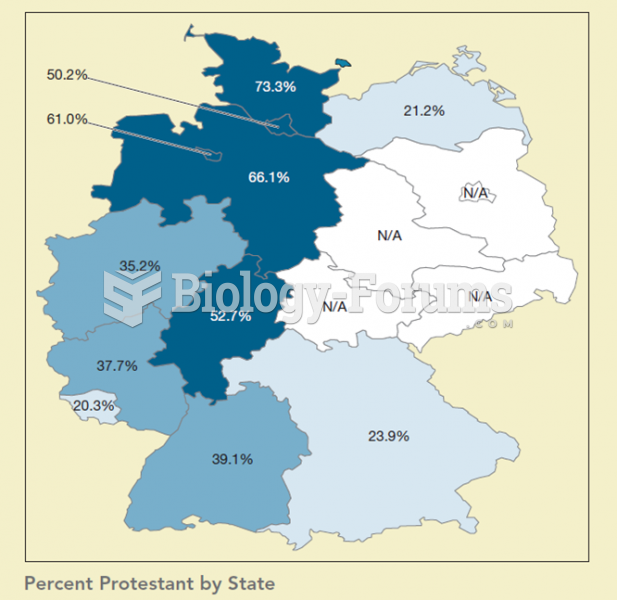 This map shows the percentage of Protestants by state in Germany. When compared to the previous map
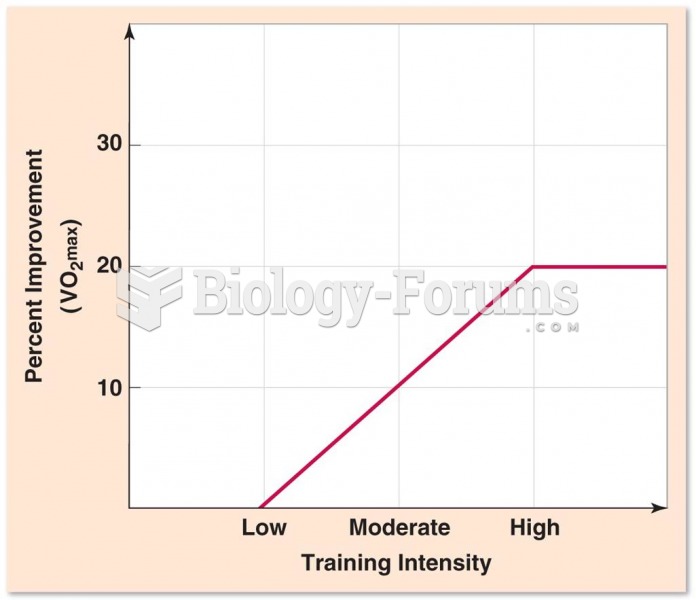 Relationship Between Training Intensity and VO2max Improvement
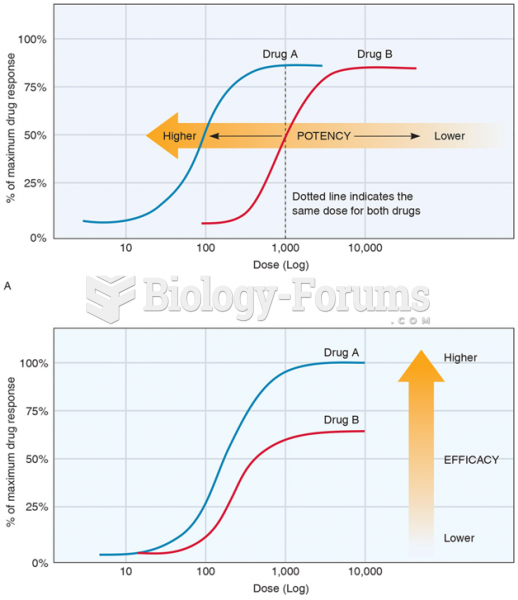 The Dose-Effect Relationship, Showing (A) Drug Potency and (B) Drug Efficacy (Or Effectiveness)
 Table - Correlation Analysis