|
|
|

 The process of X inactivation
 Palatine process
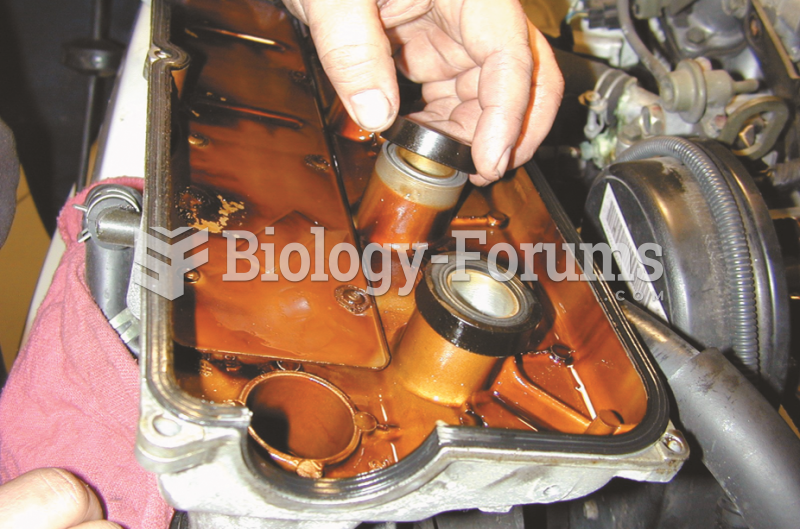 After all valves have been properly measured and adjusted as necessary, start the reassembly process ...
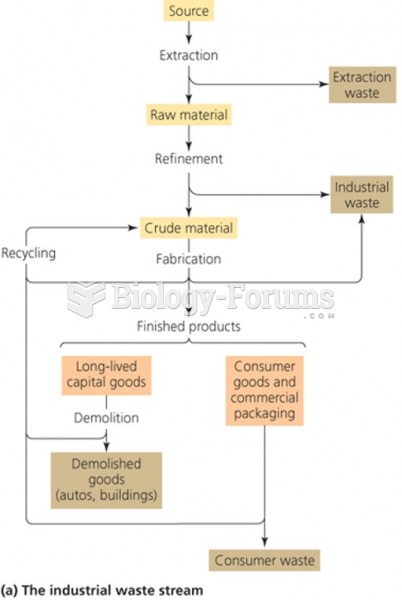 Industrial solid waste process flow diagram
 Psychologists measure basic memory capacity
 Cancer cells can move to new locations in the body, a process called metastasis