Answer to Question 1
Ans: A
Feedback:
An epidemic curve is a graph that plots the distribution of cases by the time of onset of the disease. Epidemiologic descriptive studies are research studies designed to acquire more information about the occurrence and distribution of states of health, such as characteristics of person, place, and time. Incidence density is the use of a person-time denominator in the calculation of rates. A person-day reflects one person at risk for 1 day, and a person-year represents one person at risk for 1 year. Incidence rate is the measure of the probability that people without a certain condition will develop that condition over a period of time.
Answer to Question 2
Ans: D
Feedback:
Relative risk ratio compares the incidence rate of a group exposed to a certain risk factor with the incidence rate of a group not exposed to the risk factor. It is calculated by dividing the incidence rate in the exposed group by the incidence rate in the nonexposed group. In this case, we need to first calculate the separate incidence rates for Group A and Group B and then divide to find the relative risk ratio. The incidence rate for Group A is calculated as follows: 20/400 = 0.05 1,000 = 50 cases per 1,000 population. The incidence rate for Group B is calculated as follows: 2/400 = 0.005 1,000 = 5 cases per 1,000 population. The relative risk ratio, then, is calculated as follows: 50/5 = 10.

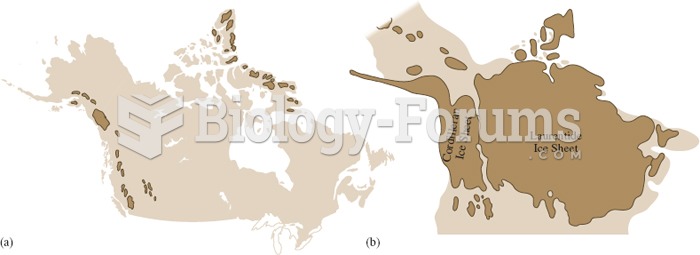 Distribution of glaciers in North America (a) in the late twentieth century, and (b) 18,000 years ag
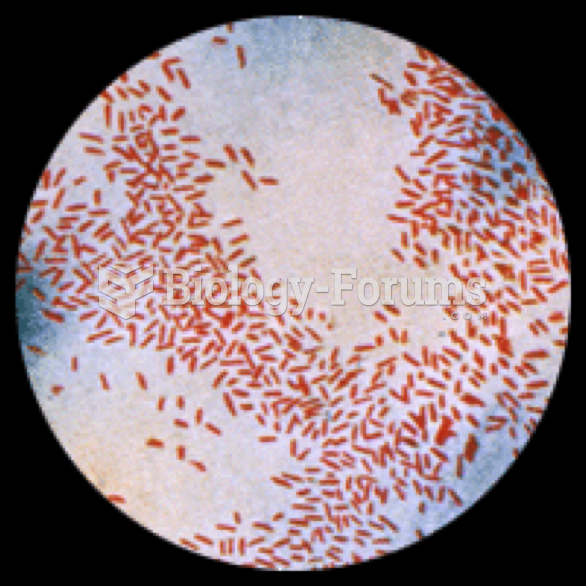 Haemophilus influenza
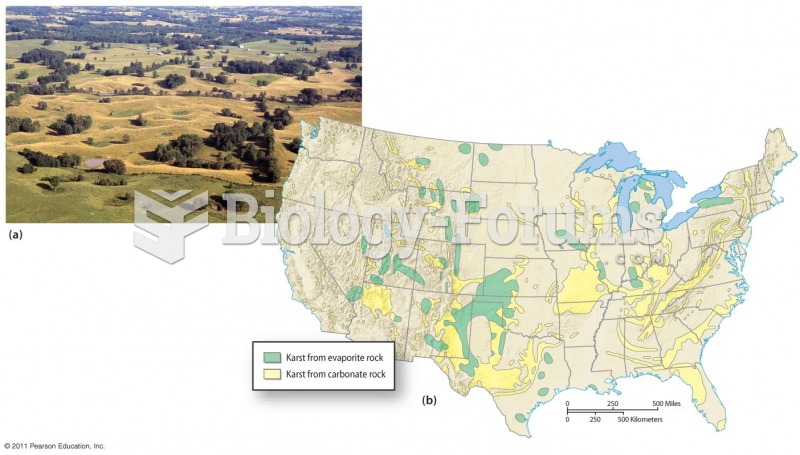 Karst Distribution
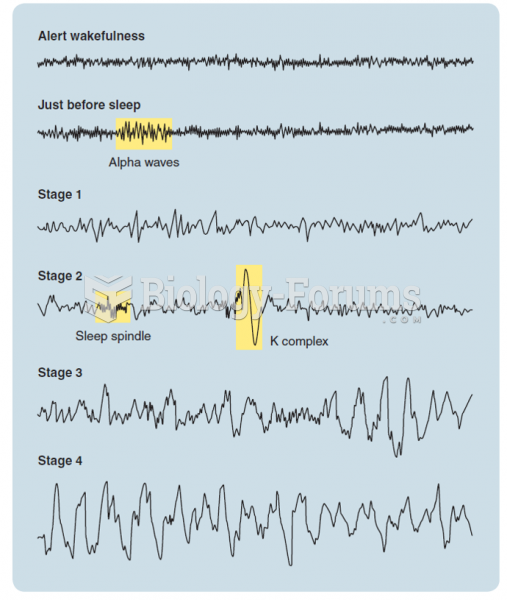 The EEG of alert wakefulness, the EEG that precedes sleep onset, and the four stages of sleep EEG. ...
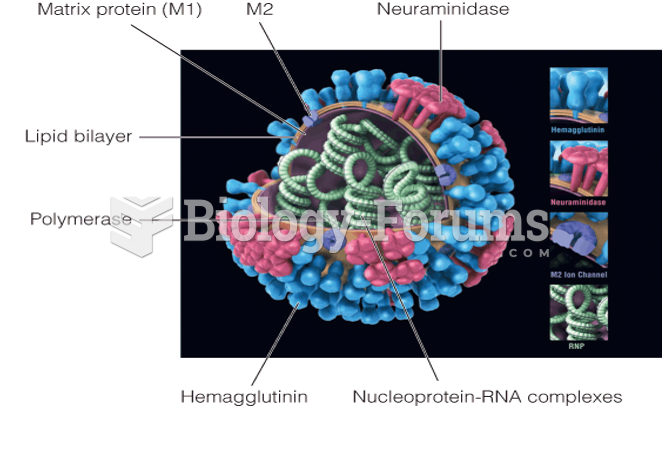 The structure of the influenza virus
 Some Cases of Population Aging