This topic contains a solution. Click here to go to the answer
|
|
|

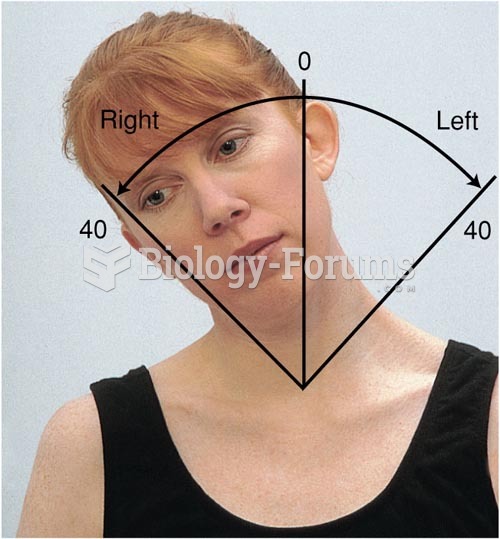 Range of Motion of the Cervical Spine, Lateral Bending
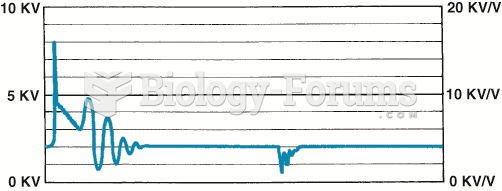 A downward-sloping spark line usually indicates high secondary ignition system resistance or an ...
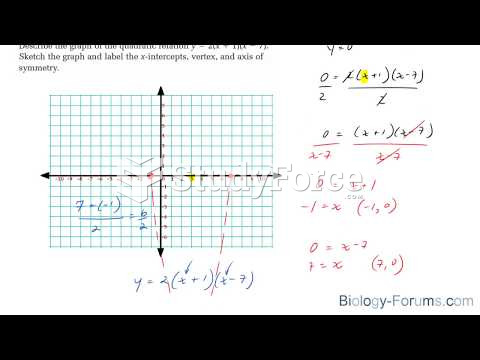 How to graph quadratic equations that are in factored form y=a(x−r)(x−s)
 graph
graph
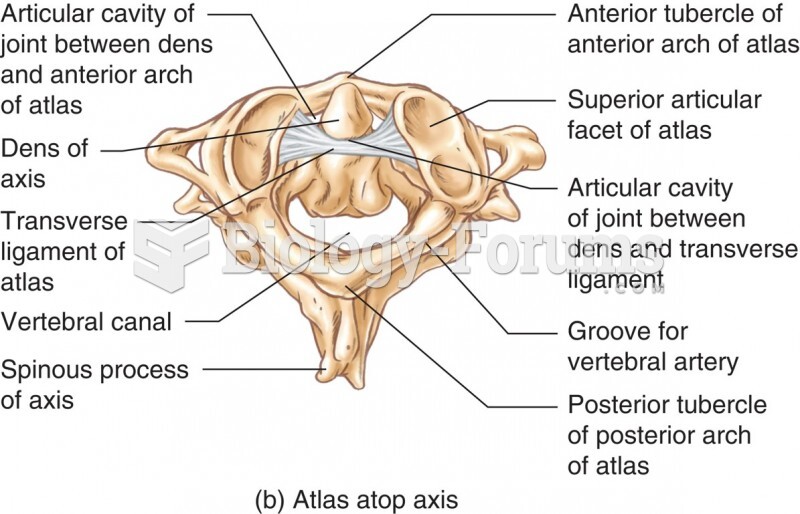 The Atlas Seated on the Axis
 The hypothalamic–pituitary–adrenal axis