This topic contains a solution. Click here to go to the answer
|
|
|

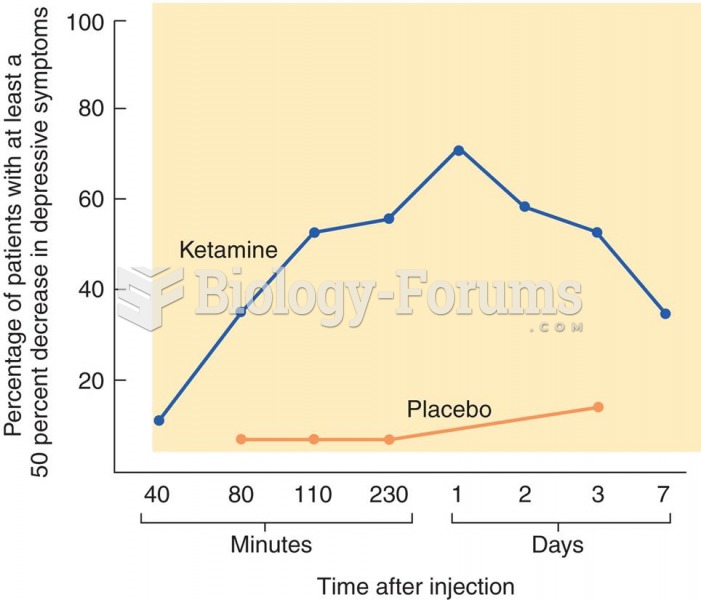 Treatment of Depression with Ketamine The graph shows the effects of ketamine on symptoms of depress
 Whites pour mustard and ketchup over black (and white) students who were integrating a lunch counter ...
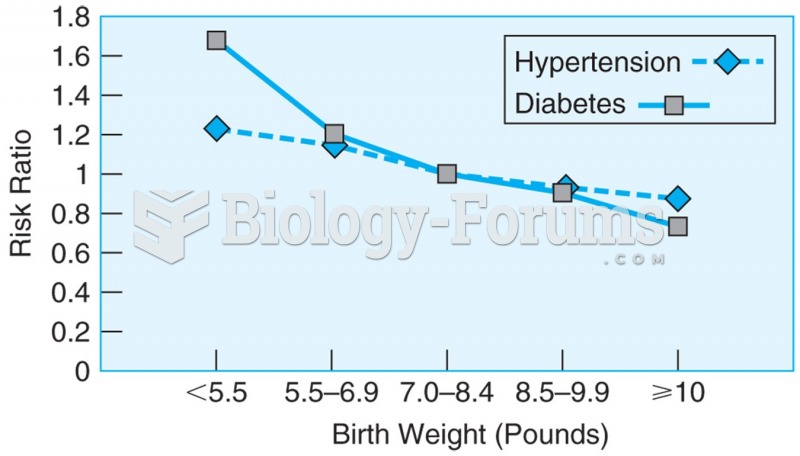 Data from more than 22,000 men over the age of 40, showing the relationship between birth weight and ...
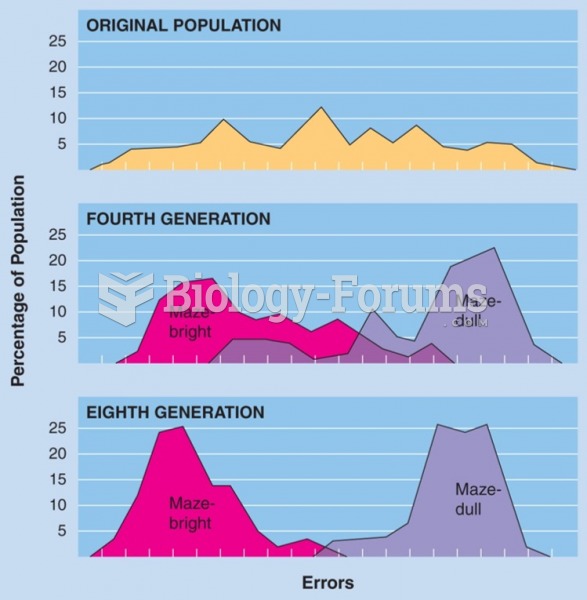 Selective breeding of maze-bright and maze-dull strains of rats by Tryon (1934). (Data from Cooper, ...
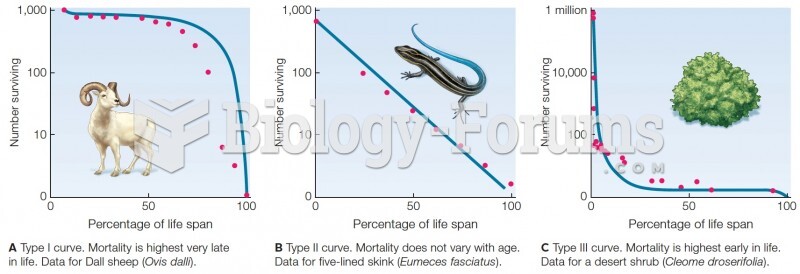 Survivorship curves. Blue lines are theoretical curves. Red dots are data from field studies.
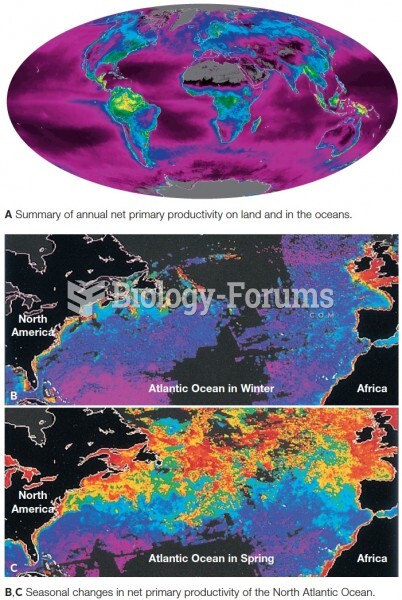 Satellite data showing net primary production. Productivity is coded as red (highest) down through o