This topic contains a solution. Click here to go to the answer
|
|
|

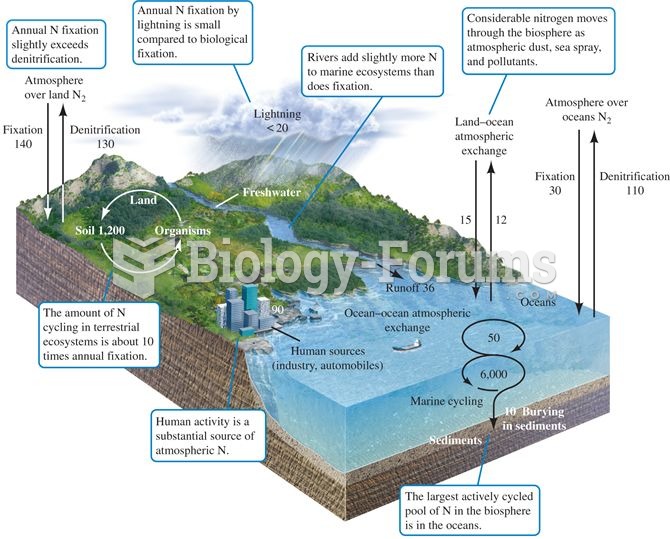 The nitrogen cycle. Numbers represent fluxes as 1012 g N per year (data from Schlesinger 1991, after
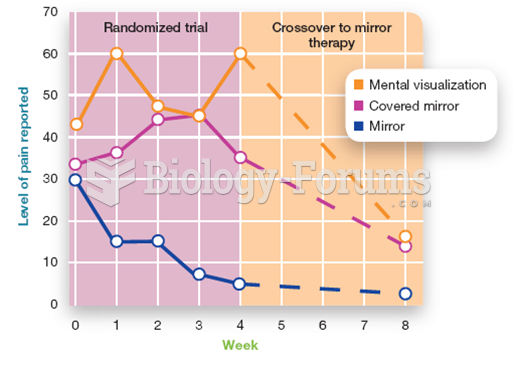 Mirror Box Therapy Compared to Mental Visualization and a Control Condition
 To help his students understand the term generalized other, Mead used baseball as an illustration. ...
 Both students with intellectual disability (ID) and students who are intellectually gifted need ...
 Chi-Square Analysis of Mendel’s Trihybrid-Cross Data
 Students pointing at a computer screen