|
|
|

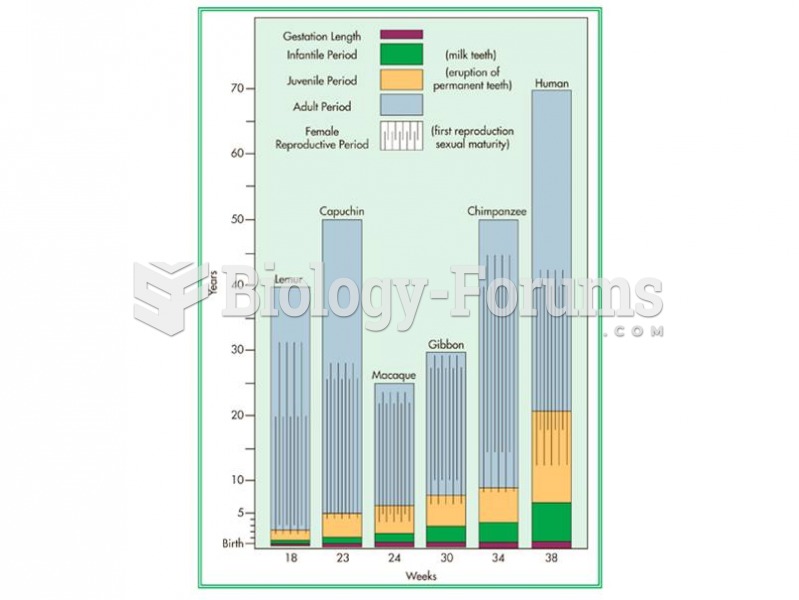 Primates exhibit prolonged life histories, spending more time in each stage of life than most other
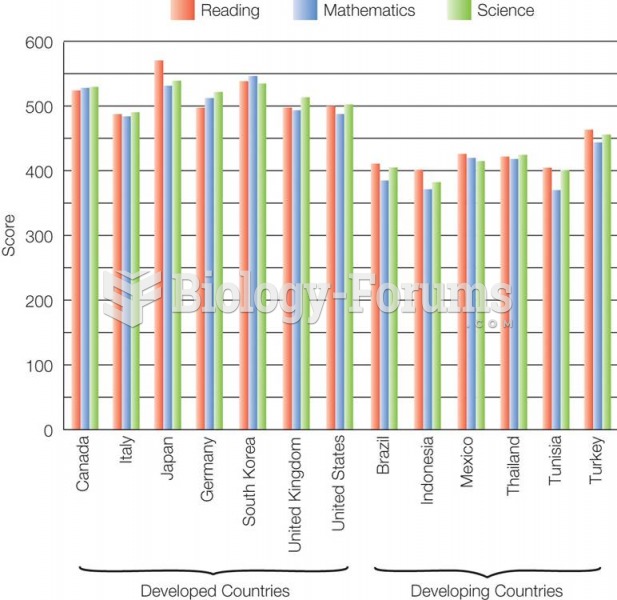 International Performance in Reading, Math, and Science, Eight Grade
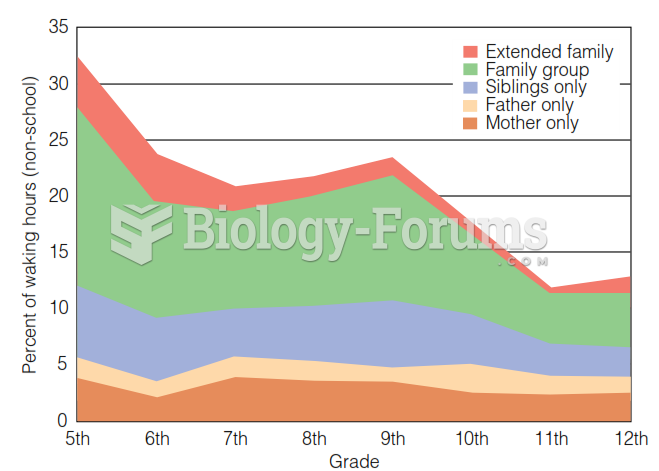 ESM Study of Time Spent with Family
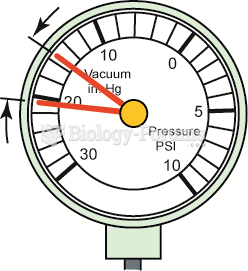 A steady needle reading that rises 2 or 3 inches Hg when the engine speed is increased slightly ...
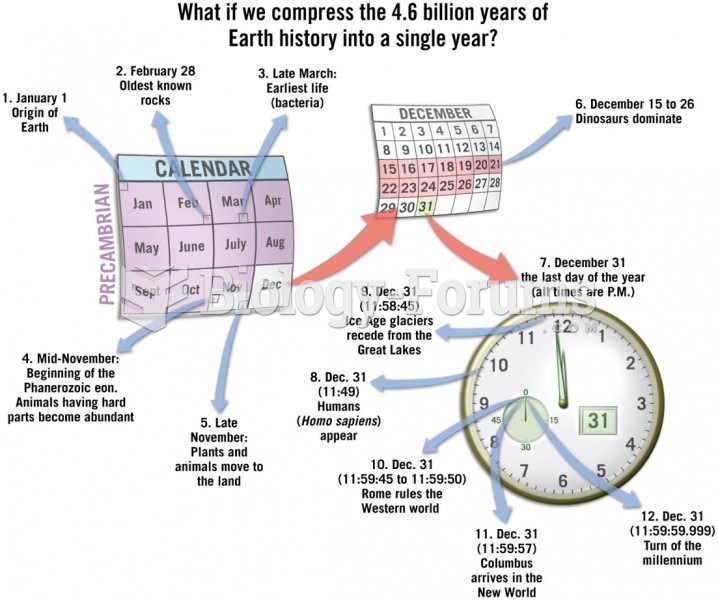 Magnitude of Geologic Time
 Change in the frequency of a lethal recessive allele, a