|
|
|

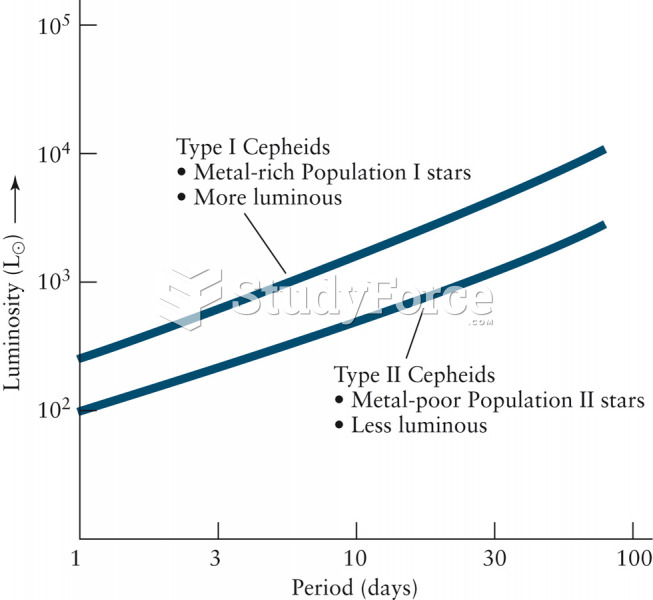 The Period-Luminosity Relation
 Studying GIF
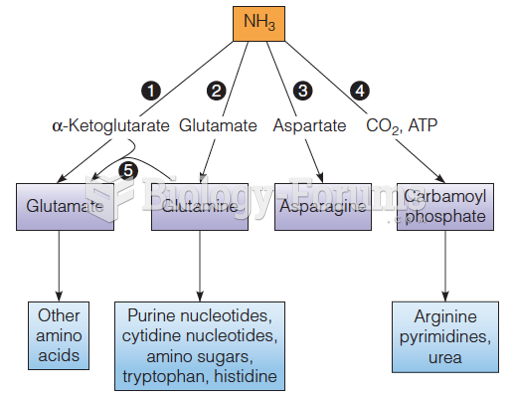 Reactions in assimilation of ammonia and major fates of the fixed nitrogen
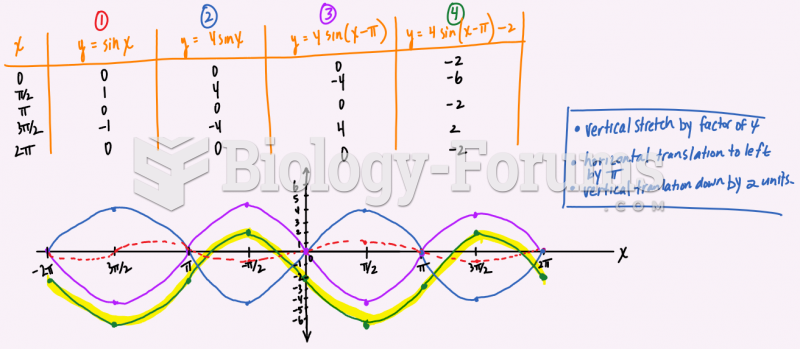 State the transformations on the function f(x)= 4sin(x-pi)-2 and then graph two cycles below.
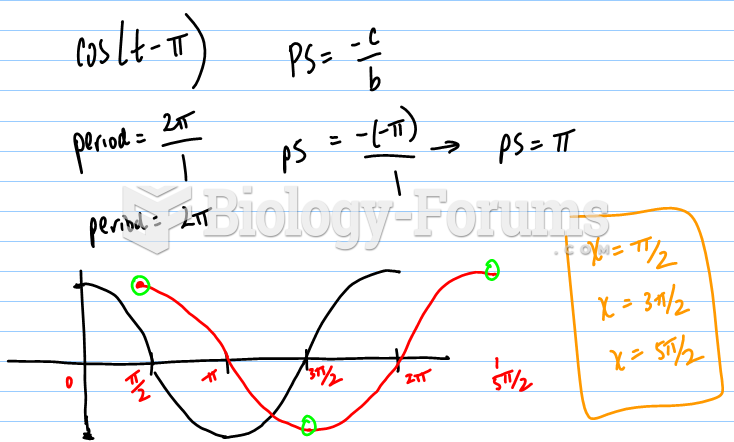 IROC on a Graph Questions
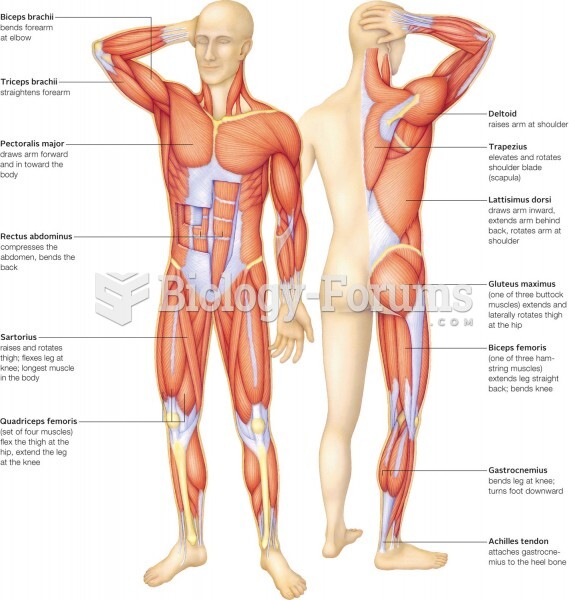 Major muscles of the human musculoskeletal system