|
|
|

 Graphic Card
 Critical thinking and the assessent process
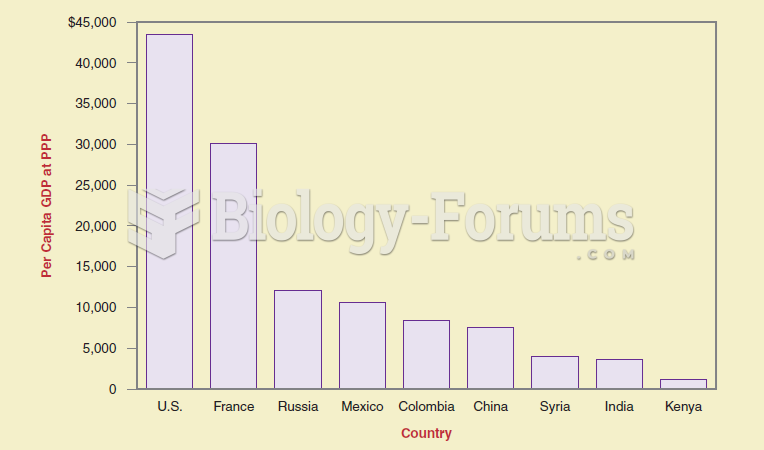 If you want to show differences between items at the same time, a bar graph is more effective than a
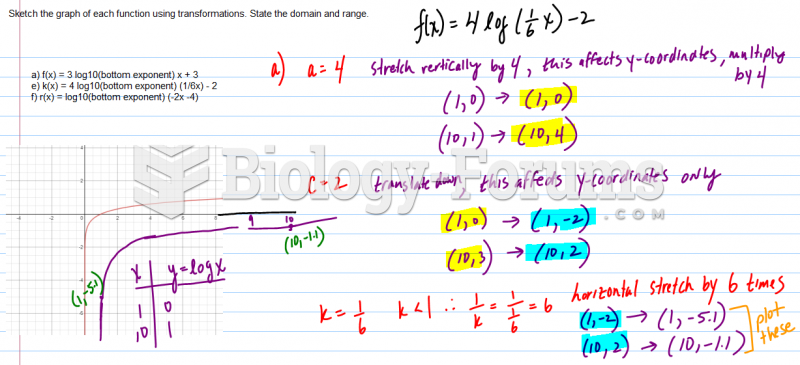 Sketch the graph of each function using transformations. State the domain and range.
 A graphic depiction of predisposing alleles characteristic of a threshold trait within a population,
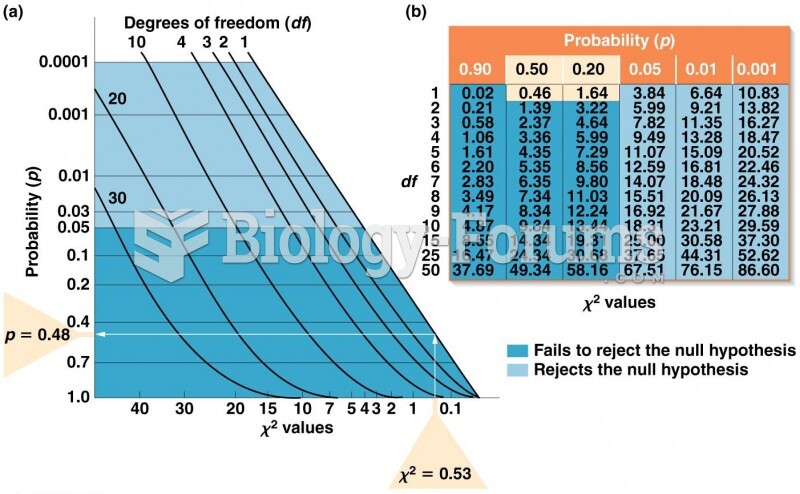 (a) Graph for converting values to p values. (b) Table of values for selected values of df