This topic contains a solution. Click here to go to the answer
|
|
|

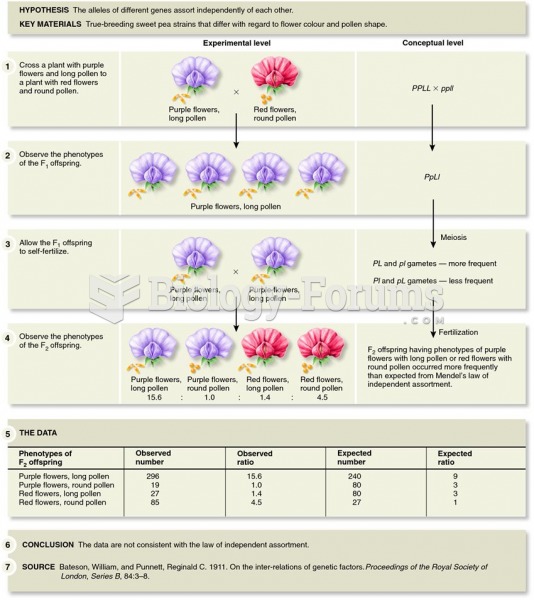 A cross of sweet peas showing that independent assortment does not always occur
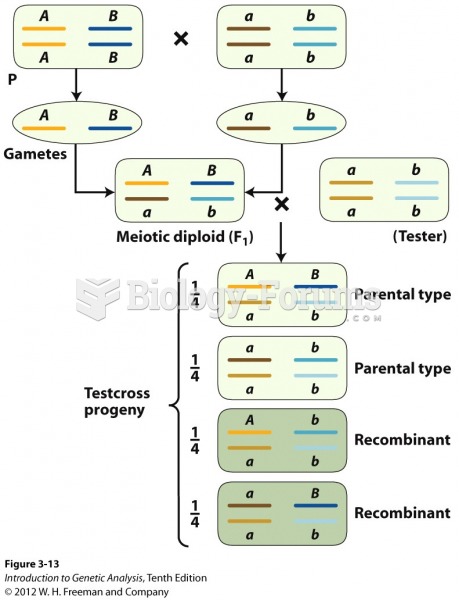 Independent assortment produces 50 percent recombinants
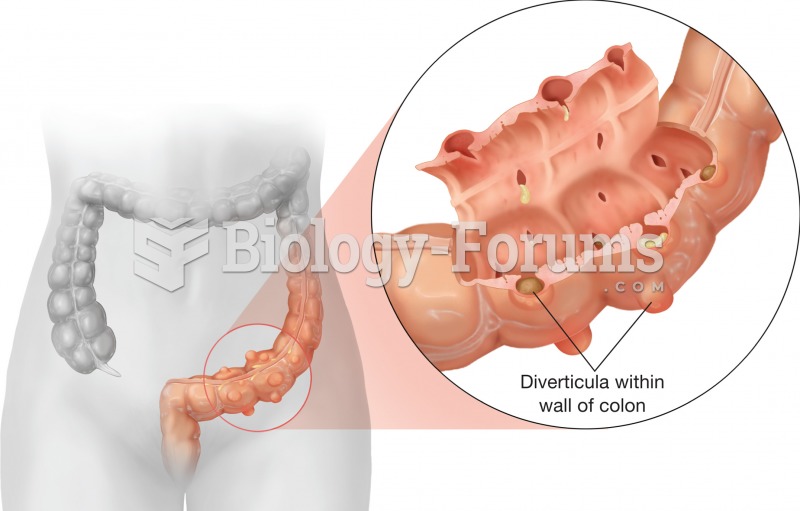 Diverticulosis. It is the presence of abnormal pouches in the wall of the large intestine (diverticu
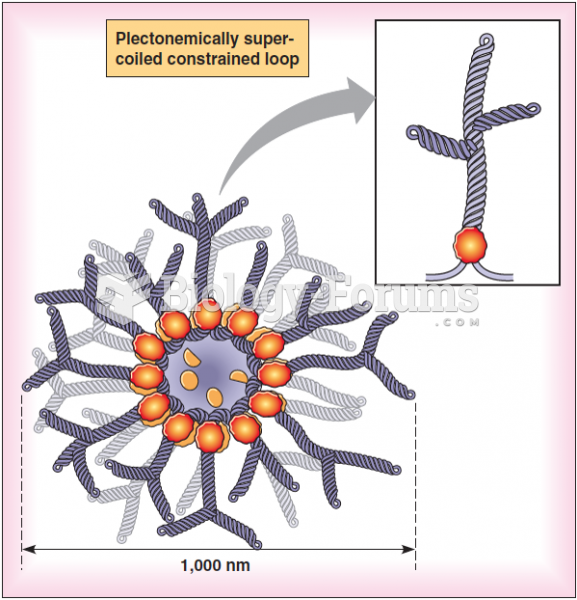 Structure of a bacterial nucleoid, showing independent domains of supercoiling
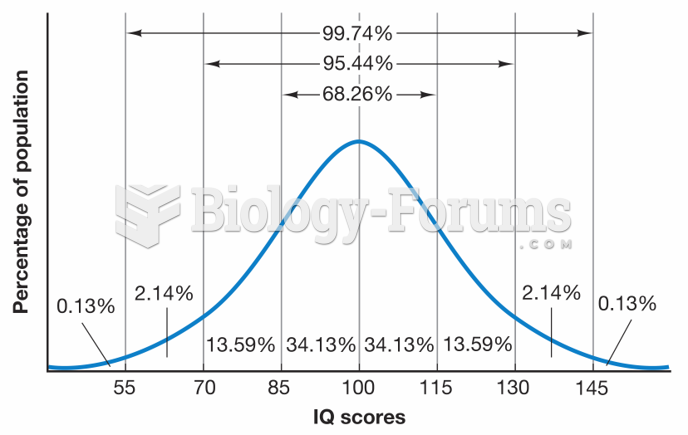 Expected Distribution of IQ Scores
 opener E. coli have been genetically engineered to produce lycopene