|
|
|

 Critical thinking involves analysis in which the nurse examines patient data available from a variet
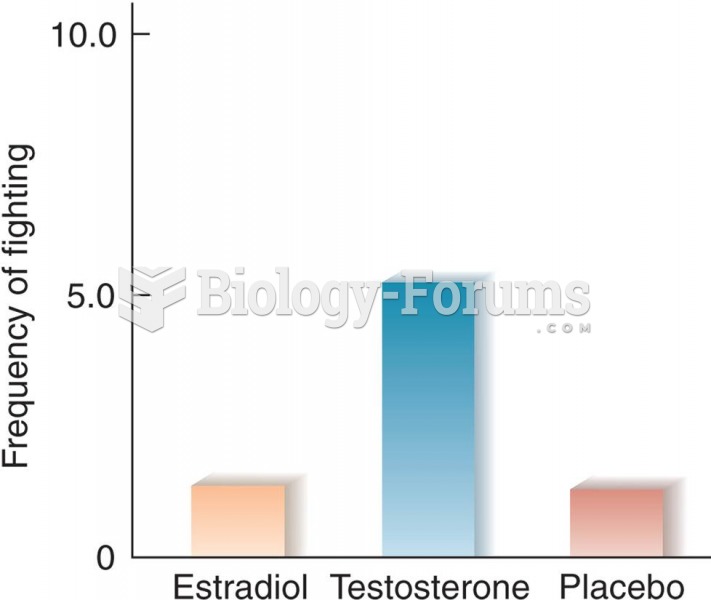 Effects of Estradiol and Testosterone on Interfemale Aggression in Rats (Based on data from van de P
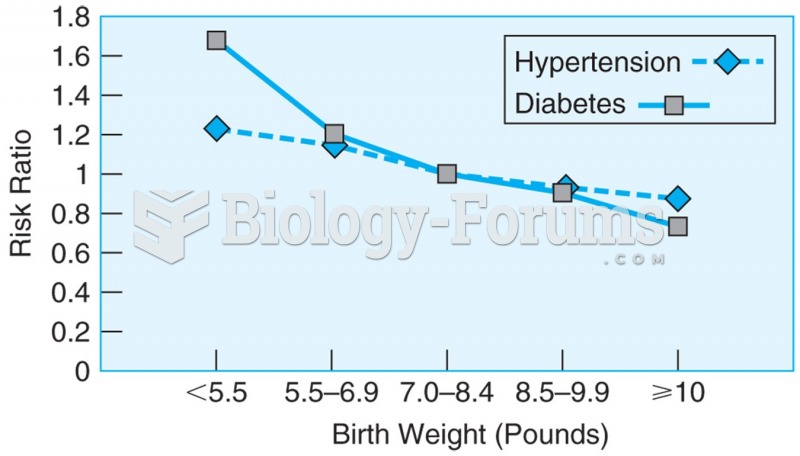 Data from more than 22,000 men over the age of 40, showing the relationship between birth weight and ...
 Basic Marketing Research: Using Microsoft Excel Data Analysis
 Piecewise Derivative Example (Continuous or not)
 graph
graph