This topic contains a solution. Click here to go to the answer
|
|
|

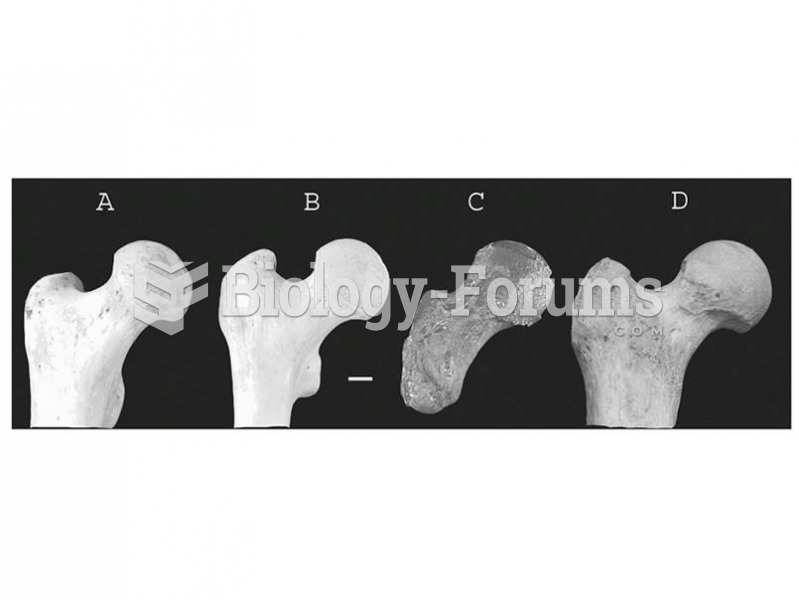 The fossil record of chimpanzees is sparse. The femur from Kikongo, Uganda (c) may represent a late
 Memory saver. The part numbers represent components from Radio Shack®.
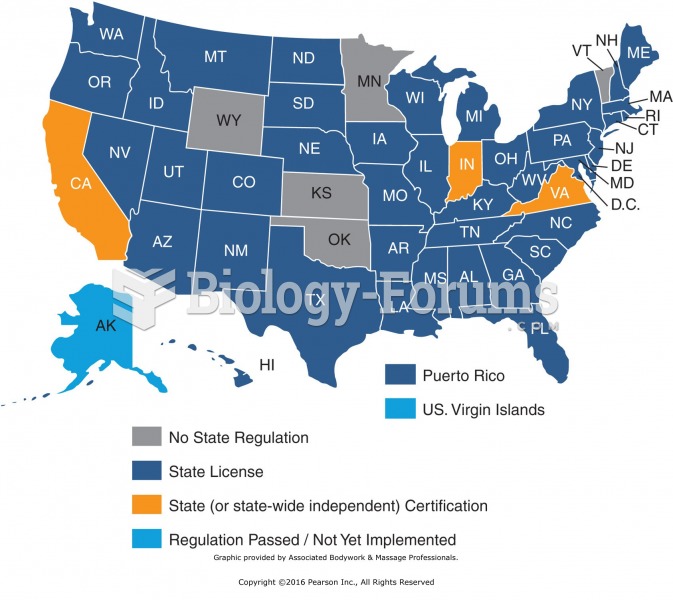 States that require licensing or certification. Graphic provided by Associated Bodywork & ...
 Apply direct pressure to points along the shoulders. Stand to one side and use your forearm to apply ...
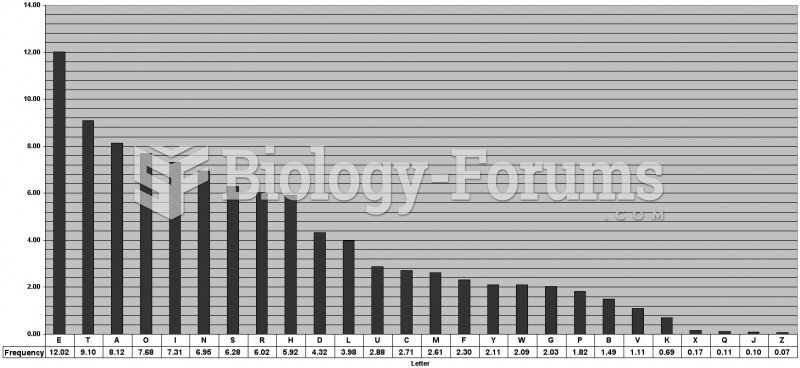 Letter Frequency Table
 Lod Score Values for the Families in Figure 5.15