|
|
|

 Pocket gophers and ecosystem structure (data from Huntly and Inouye 1988).
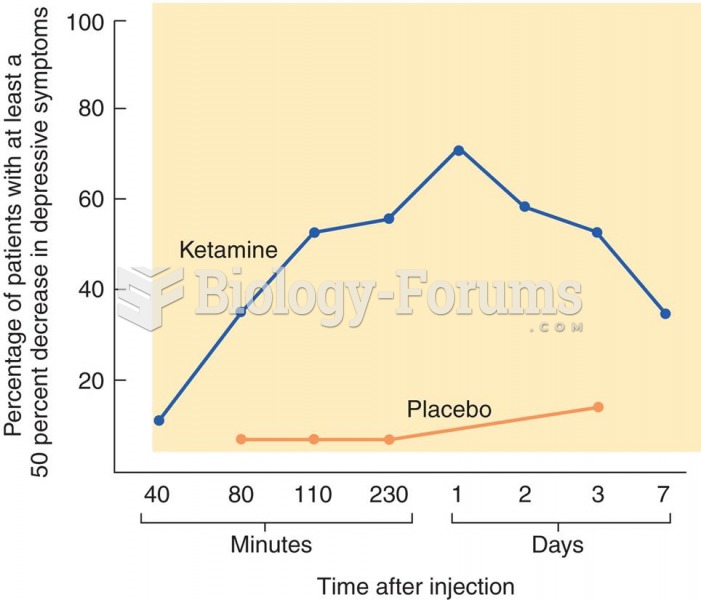 Treatment of Depression with Ketamine The graph shows the effects of ketamine on symptoms of depress
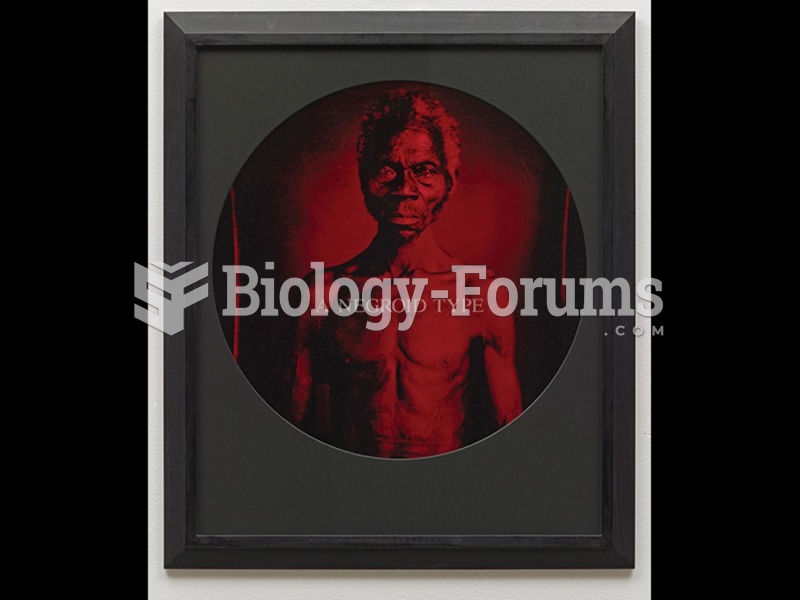 Carrie Mae Weems, A Negroid Type, from the series From Here I Saw What Happened and I Cried.
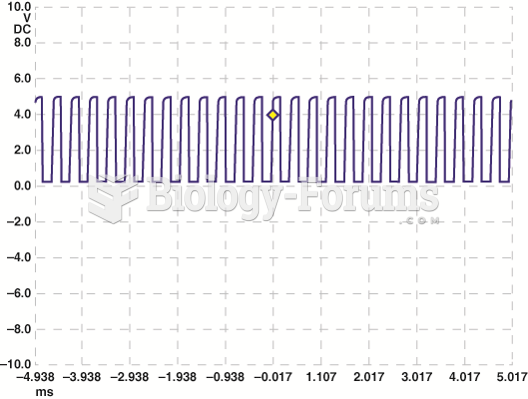 A scope display showing a normal Chevrolet Equinox MAF sensor at idle speed. the frequency is 2,600 ...
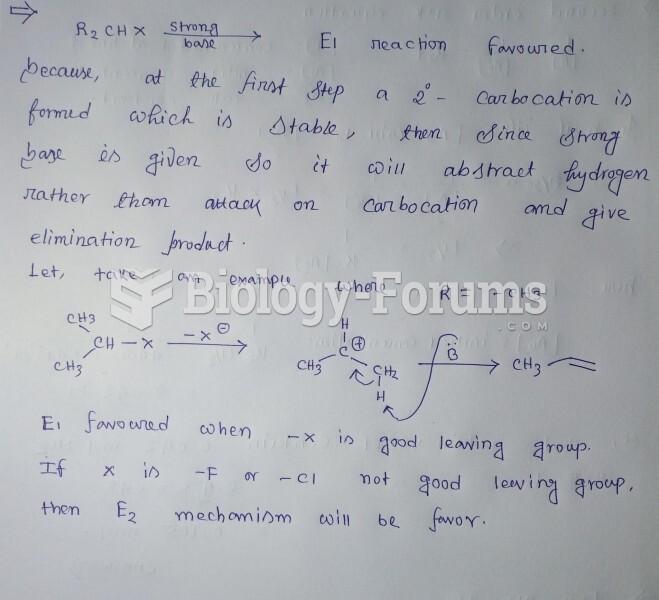 For each substrate below, choose which reaction type is favored. Place the letter of the ...
 ABO blood type