Question 1
Retail price data for
n = 60 hard disk drives were recently reported in a computer magazine. Three variables were recorded for each hard disk drive:
y = Retail PRICE (measured in dollars)
x1 = Microprocessor SPEED (measured in megahertz)
(Values in sample range from 10 to 40)
x2 = CHIP size (measured in computer processing units)
(Values in sample range from 286 to 486)
A first-order regression model. was fit to the data. Part of the printout follows:

Identify and interpret the estimate of
β2.
Question 2
As part of a study at a large university, data were collected on
n = 224 freshmen computer science (CS) majors in a particular year. The researchers were interested in modeling
y, a student's grade point average (GPA) after three semesters, as a function of the following independent variables (recorded at the time the students enrolled in the university):
x1 = average high school grade in mathematics (HSM)
x2 = average high school grade in science (HSS)
x3 = average high school grade in English (HSE)
x4 = SAT mathematics score (SATM)
x5 = SAT verbal score (SATV)
A first-order model was fit to data.
A 95% confidence interval for
β1 is (.06, .22). Interpret this result.
◦ We are 95% confident that a CS freshman's GPA increases by an amount between .06 and .22 for every 1-point increase in average HS math grade, holding
x2 -
x5 constant.
◦ We are 95% confident that the mean GPA of all CS freshmen after three semesters falls between .06 and .22.
◦ 95% of the GPAs fall within .06 to .22 of their true values.
◦ We are 95% confident that a CS freshman's HS math grade increases by an amount between .06 and .22 for every 1-point increase in GPA, holding
x2 -
x5 constant.


 How the study of genomes and proteomes can provide us with connections to different biological level
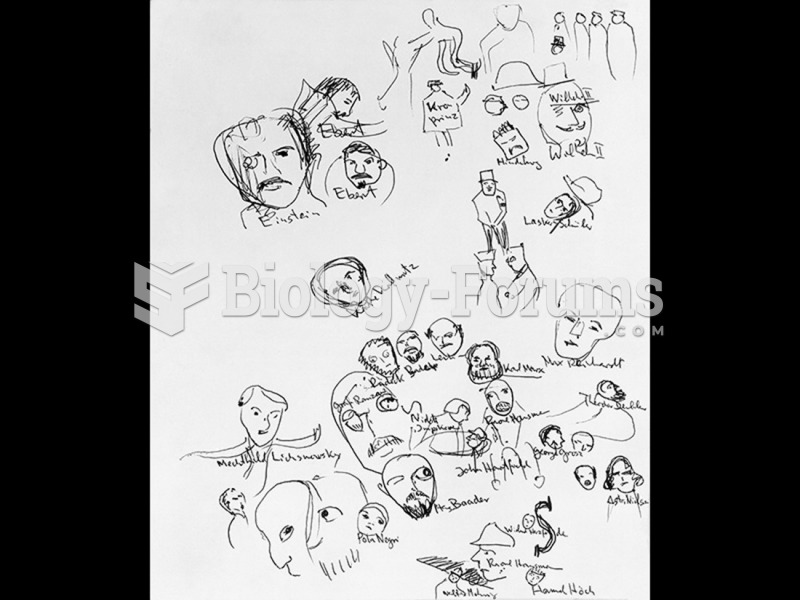 Hannah Höch, Study for "Cut with the Kitchen Knife Dada through the Last Weimar Beer Belly ...
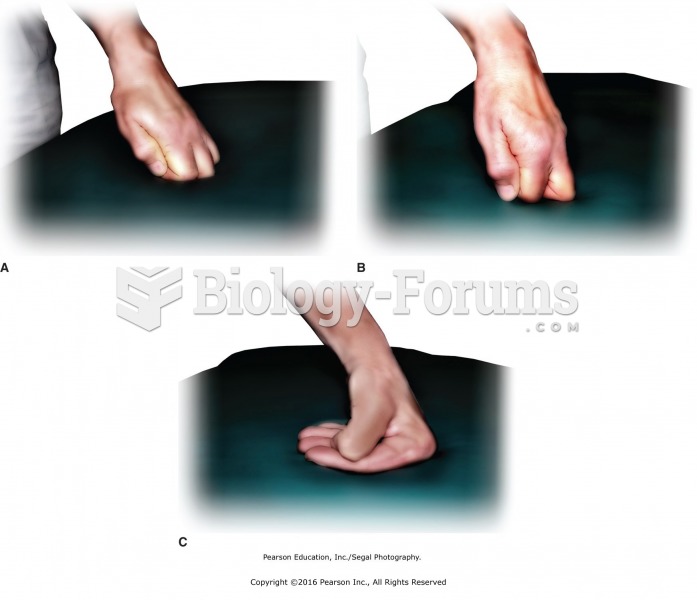 Different hand positions and working surfaces for massage applications on large muscles. A. Flat ...
 How to find the domain of a function (Part 3)
 Chemistry: The Central Science (13th Edition)
 Students working around a computer