This topic contains a solution. Click here to go to the answer
|
|
|

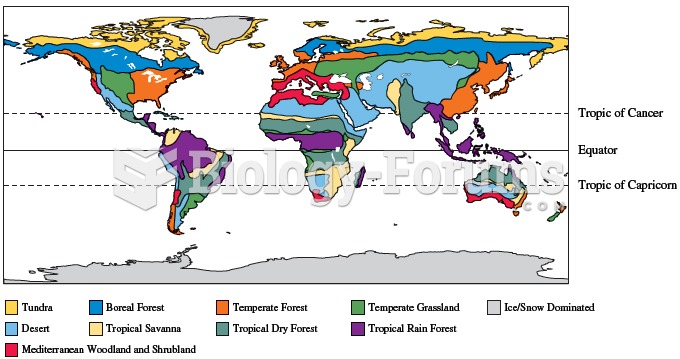 Variation in climatic conditions result in geographic variation in the distribution of biome types a
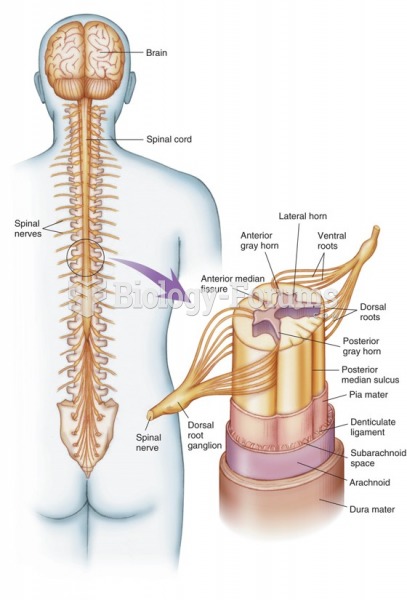 The brain, spinal cord, and spinal nerves. An expanded view of the spinal cord is shown.
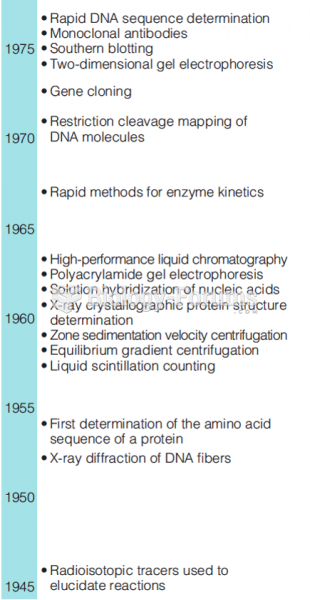 Recent history of biochemistry shown by the introduction of new techniques. (part 1)
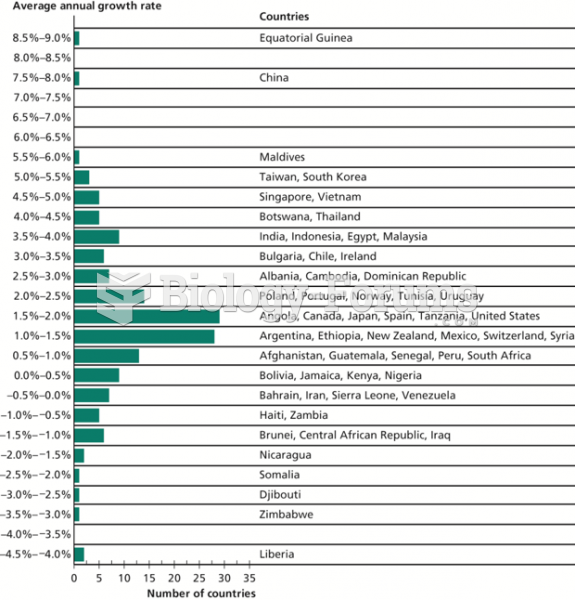 The Distribution of Growth Rates, 1975–2009
 Discrete random variables- Probability Distribution Function
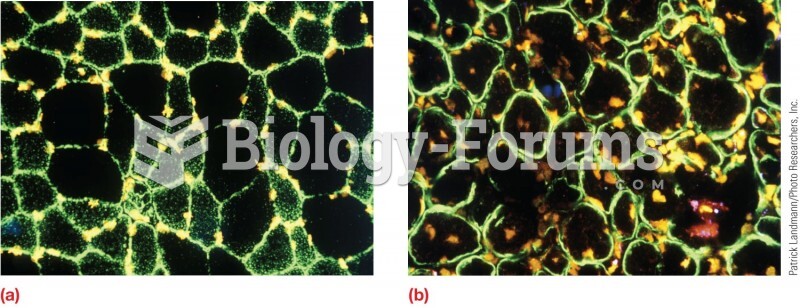 Distribution of dystrophin in muscle cells. (a) In normal muscle cells, all the dystrophin is locate