This topic contains a solution. Click here to go to the answer
|
|
|

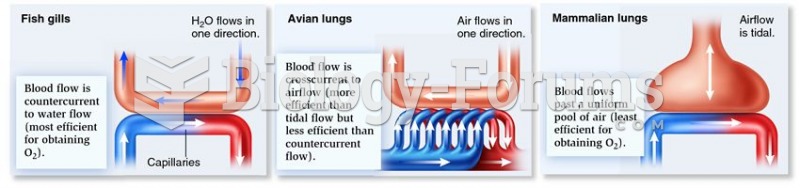 Relationships between direction of flow of blood and water or air in different vertebrates.
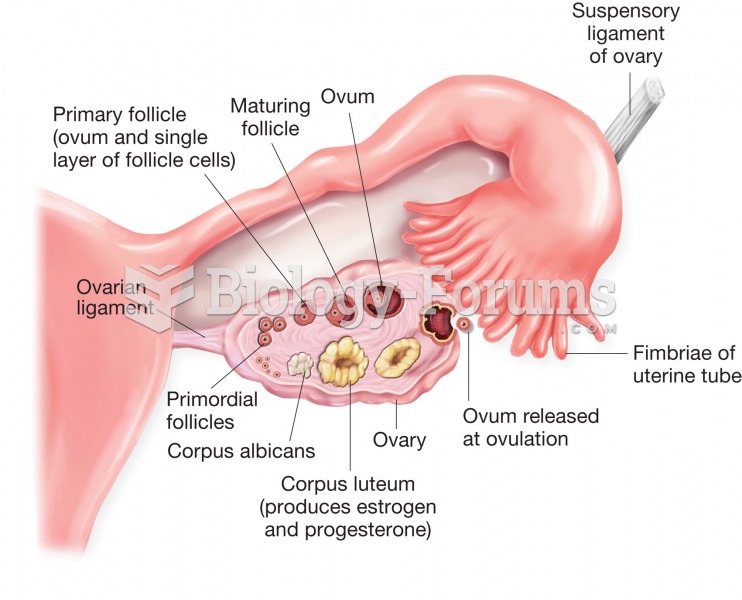 Structure of the ovary and uterine (fallopian) tube. Figure illustrates stages of ovum development a
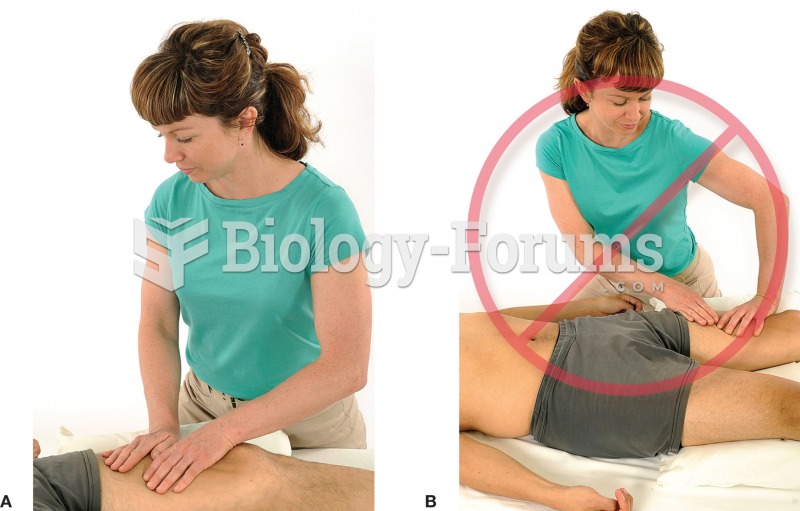 a) Face the direction of your stroke. b) Avoid facing away from your stroke.
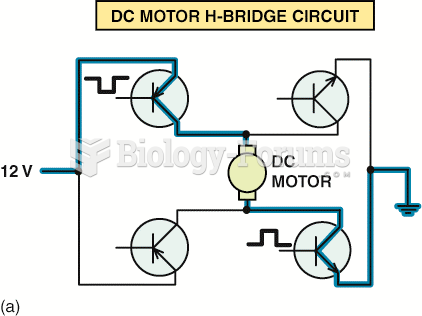 An H-bridge circuit is used to control the direction of the DC electric motor of the electronic ...
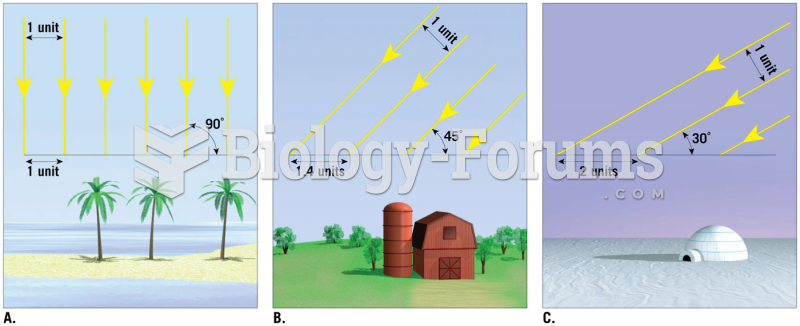 Relationship of Sun Angle and Solar Radiation
 Relationship of a DNA base sequence to peptide structure