This topic contains a solution. Click here to go to the answer
|
|
|

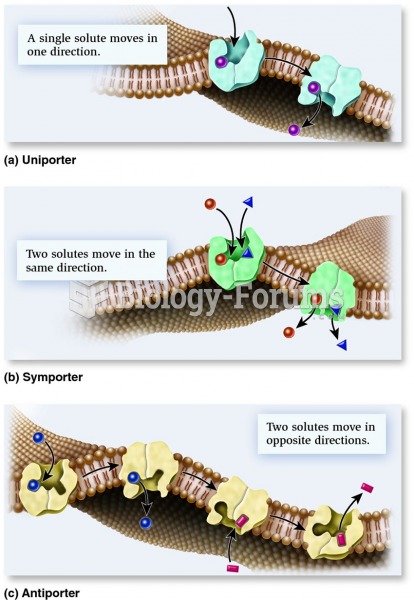 Types of transporters based on the direction of transport.
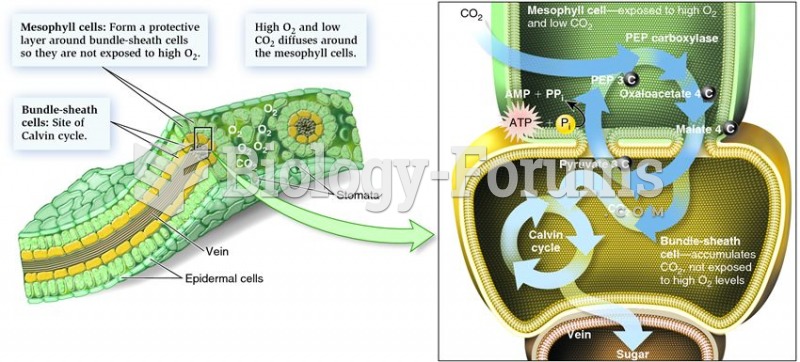 Leaf structure and its relationship to the C4 cycle
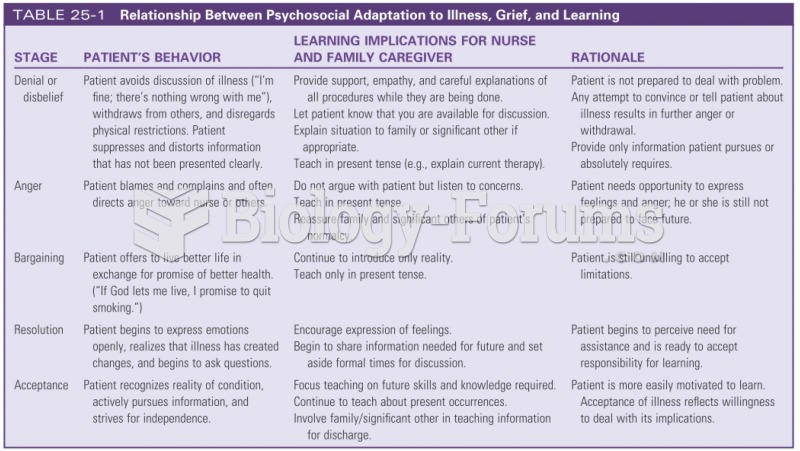 Relationship between psychosocial adaptation
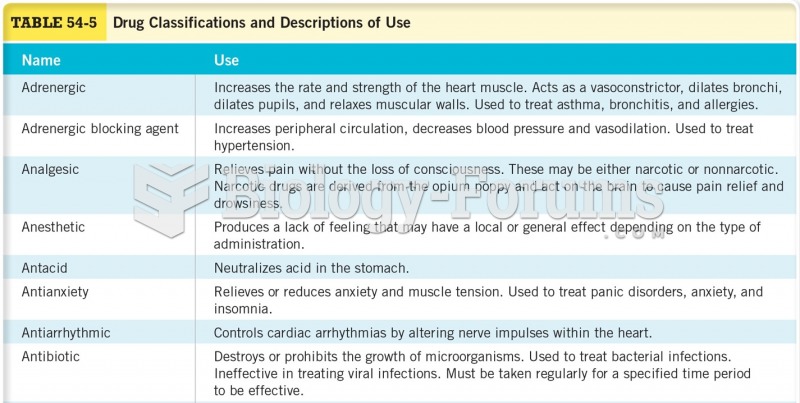 Drug Classification and Description of Use
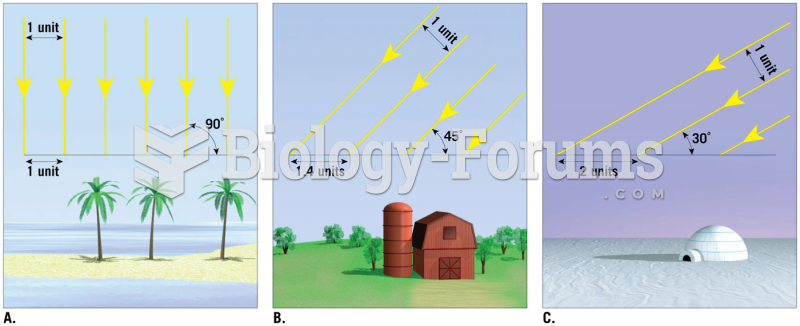 Relationship of Sun Angle and Solar Radiation
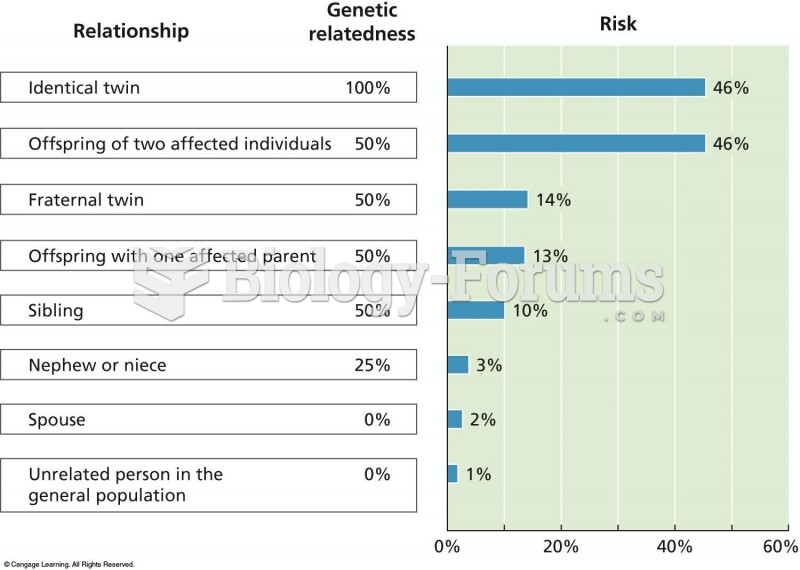 The lifetime risk for schizophrenia varies with the degree of relationship to an affected individual