|
|
|

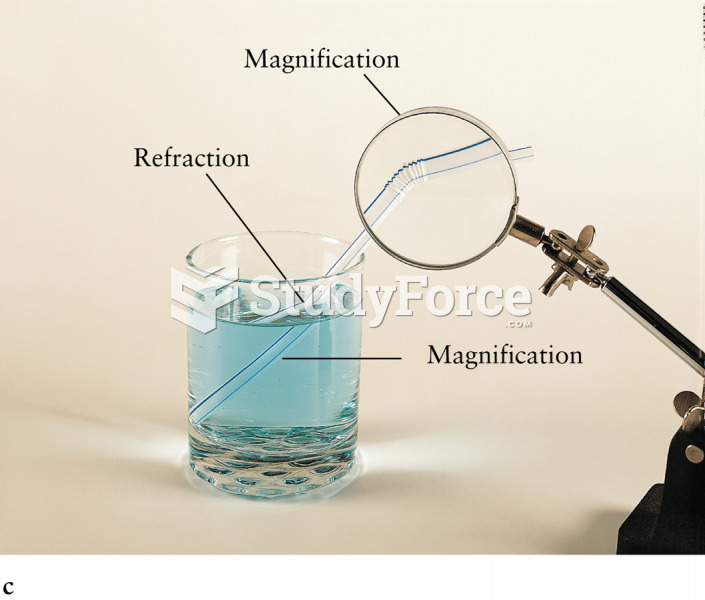 Refraction Through Uniform and Variable Thickness Glasses
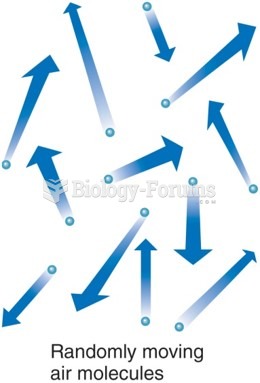 Gas molecules have no bonds to other molecules and move in random motion.
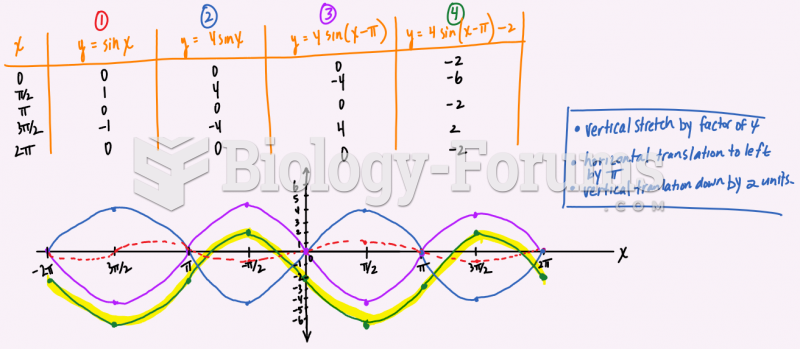 State the transformations on the function f(x)= 4sin(x-pi)-2 and then graph two cycles below.
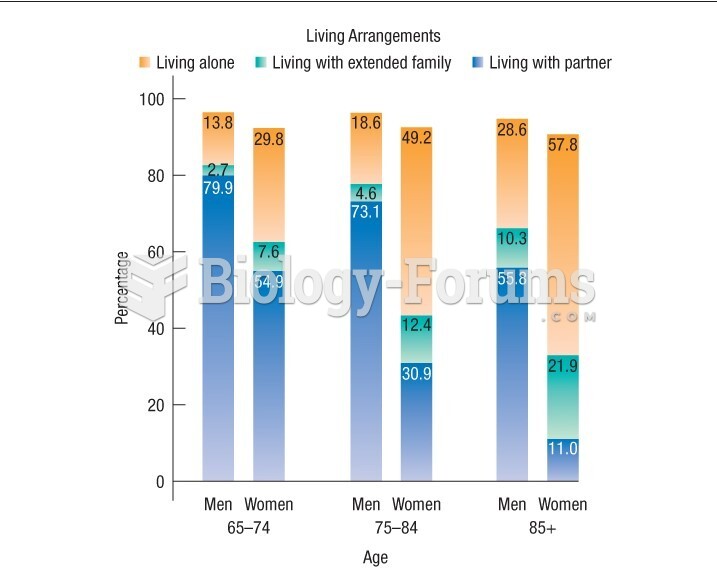 Graph shows the living arrangements of Canadian seniors
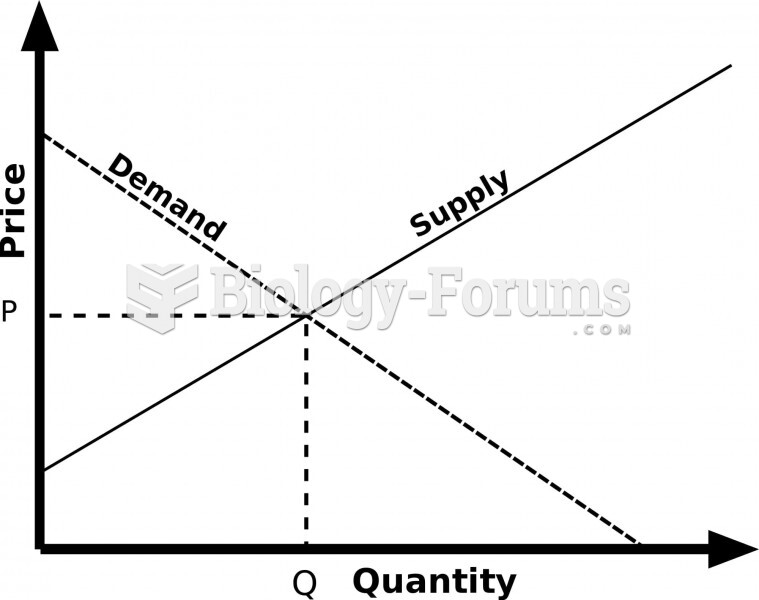 The original Supply and Demand graph
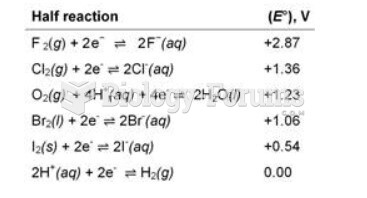 table
table