This topic contains a solution. Click here to go to the answer
|
|
|

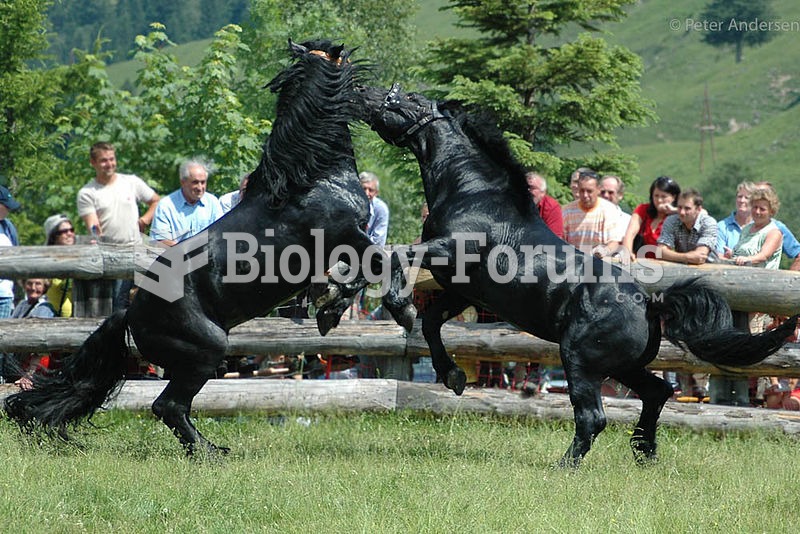 Fights for dominance are normally brief, and sometimes merely displaying dominant gestures without p
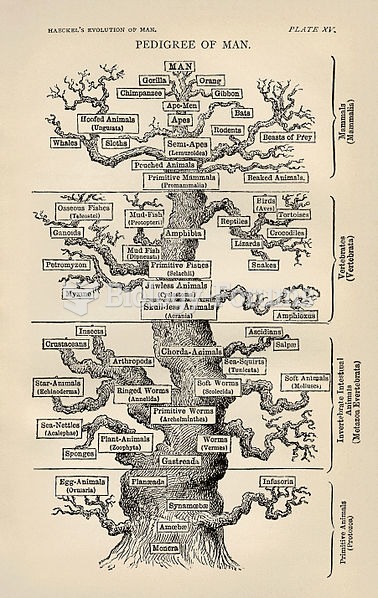 Ernst Haeckel's Tree of Life (1879)
 Testing for Glucose in Urine Using the Tablet Method
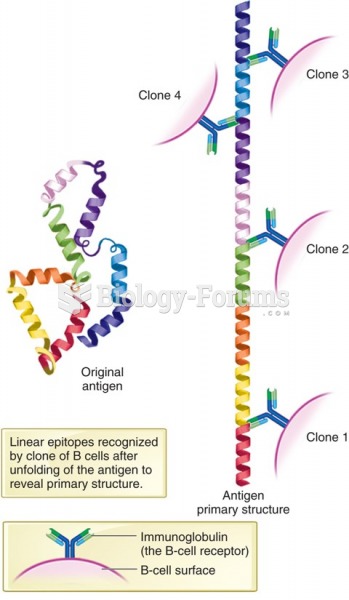 Schematic diagram showing polyclonal response by B cells against linear epitopes.
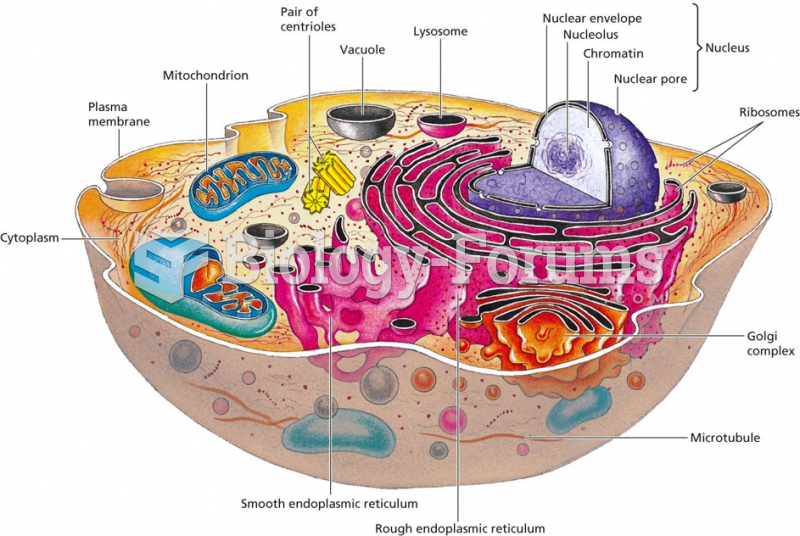 A diagram of a generalized human cell
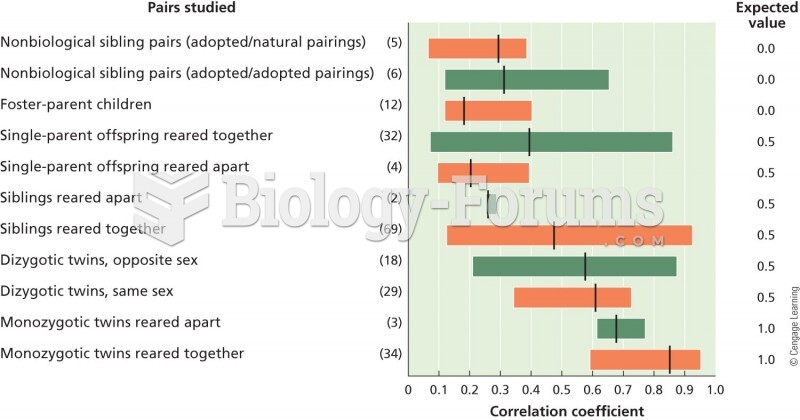 A graphical representation of correlations in IQ measurements in different sets of individuals. The