Suppose that wine bottles coming from Sonoma County Wineries have wine content (in ml) that is uniformly distributed between 115 ml and 125 ml. Consider taking a random sample of 100 such bottles and recording the wine content for these 100 bottles.
Which of the histograms best represents the approximate distribution of the wine content for 100 randomly selected bottles from Sonoma County Wineries?

1.Histogram I
2.Histogram II
3.Histogram III
Question 2Given a population that is normally distributed with a = 65 and = 3, the probability of randomly selecting an object greater than 68 is:
1.0.5000
2.0.6827
3.0.8413
4.0.1587

 Beijing introduces recycling banks that pay subway credits for bottles
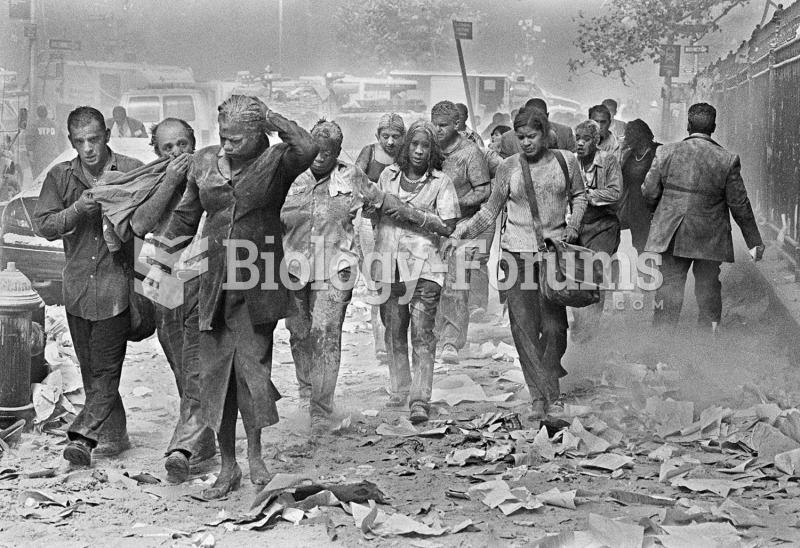 New Yorkers flee from the dust caused by the collapse of the twin towers of the World Trade Center f
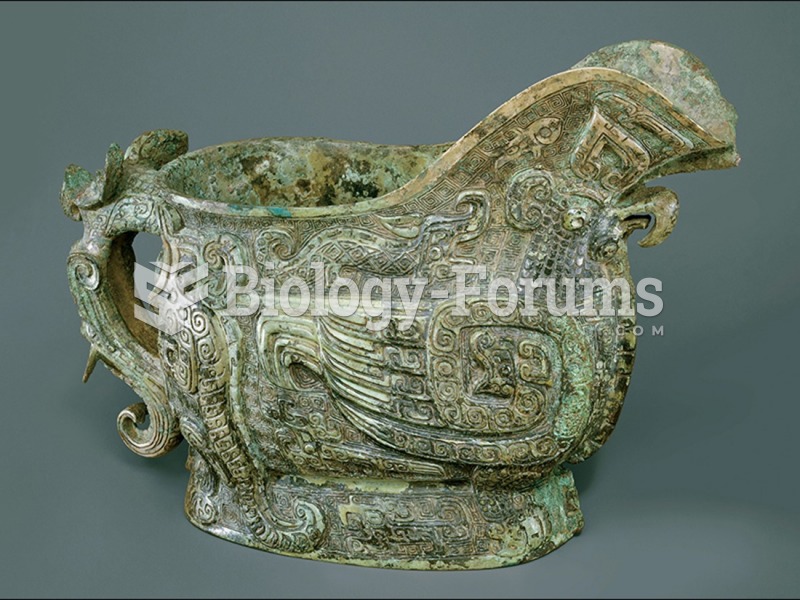 Spouted ritual wine vessel (Guang).
 Let f be a real function with domain R. Suppose that for each ǫ > 0, there is a continuous ...
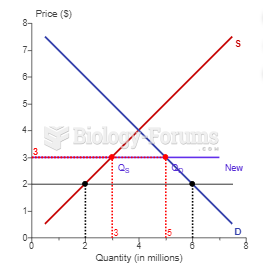 Suppose a country imports televisions. The country's supply and demand curves are shown in ...
 Overall Physics content topics for highschool